

Support Vector Machines (SVM) Algorithm Explained


So you’re working on a text classification problem. You’re refining your training data, and maybe you’ve even experimented with Naive Bayes. You’re feeling confident in your dataset, and want to take it one step further.
Enter Support Vector Machines (SVM), a fast and dependable classification algorithm that performs very well with a limited amount of data to analyze.
Perhaps you have dug a bit deeper, and ran into terms like linearly separable, kernel trick and kernel functions. But fear not! The idea behind the SVM algorithm is simple, and applying it to NLP doesn’t require most of the complicated stuff.
In this guide, you'll learn the basics of SVM, and how to use it for text classification. Finally, you'll see how easy it is to get started with a code-free tool like MonkeyLearn.
Start classifying your text with SVM
- What is Support Vector Machines?
- How Does SVM Work?
- Using SVM with Natural Language Classification
- Simple SVM Classifier Tutorial
What is Support Vector Machines?
A support vector machine (SVM) is a supervised machine learning model that uses classification algorithms for two-group classification problems. After giving an SVM model sets of labeled training data for each category, they’re able to categorize new text.
Compared to newer algorithms like neural networks, they have two main advantages: higher speed and better performance with a limited number of samples (in the thousands). This makes the algorithm very suitable for text classification problems, where it’s common to have access to a dataset of at most a couple of thousands of tagged samples.
How Does SVM Work?
The basics of Support Vector Machines and how it works are best understood with a simple example. Let’s imagine we have two tags: red and blue, and our data has two features: x and y. We want a classifier that, given a pair of (x,y) coordinates, outputs if it’s either red or blue. We plot our already labeled training data on a plane:

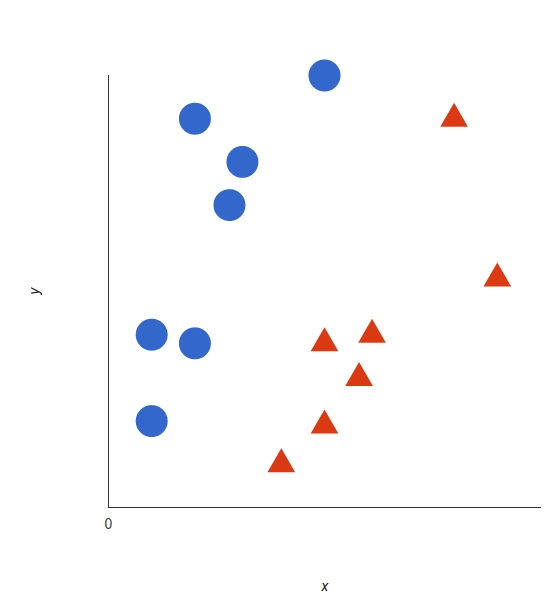
Our labeled data
A support vector machine takes these data points and outputs the hyperplane (which in two dimensions it’s simply a line) that best separates the tags. This line is the decision boundary: anything that falls to one side of it we will classify as blue, and anything that falls to the other as red.

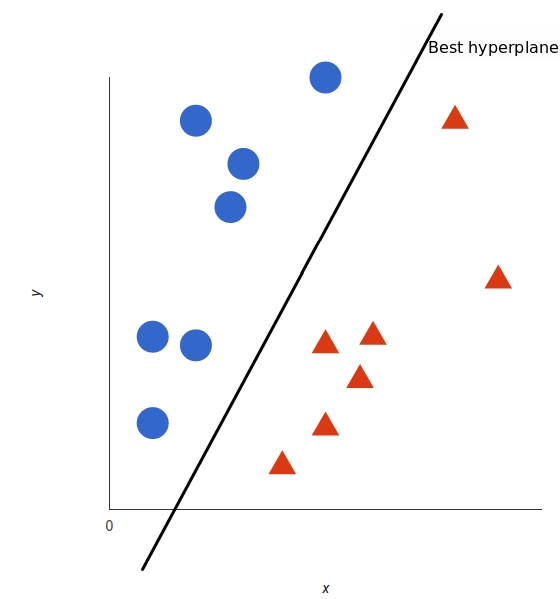
In 2D, the best hyperplane is simply a line
But, what exactly is the best hyperplane? For SVM, it’s the one that maximizes the margins from both tags. In other words: the hyperplane (remember it's a line in this case) whose distance to the nearest element of each tag is the largest.

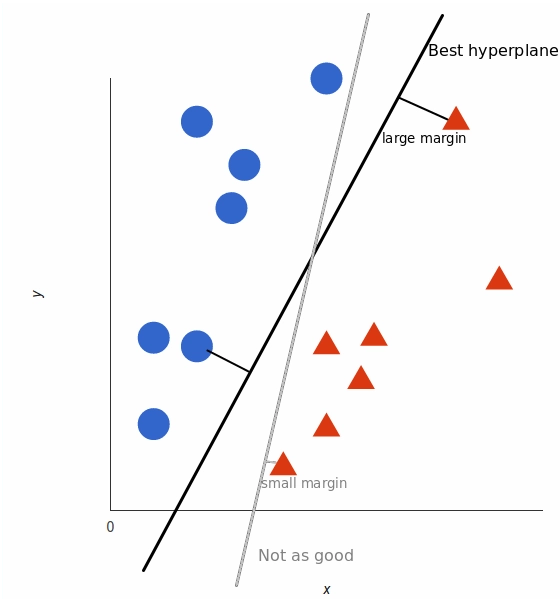
Not all hyperplanes are created equal
You can check out this video tutorial to learn exactly how this optimal hyperplane is found.
Nonlinear data
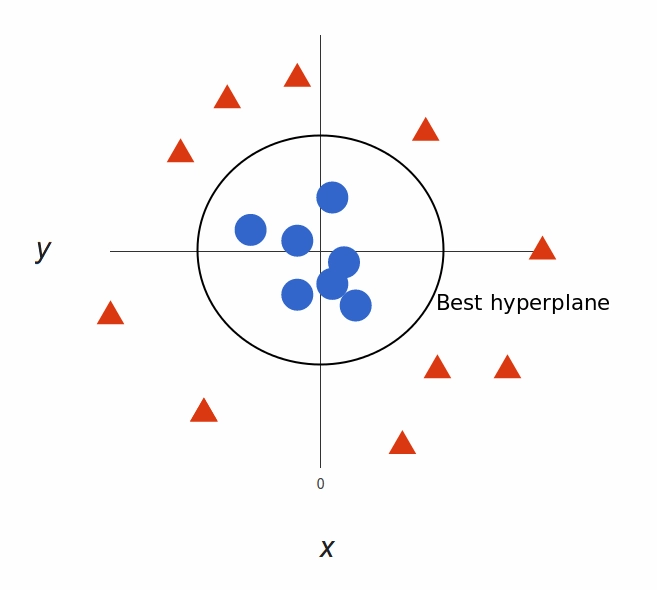
Now this example was easy, since clearly the data was linearly separable — we could draw a straight line to separate red and blue. Sadly, usually things aren’t that simple. Take a look at this case:

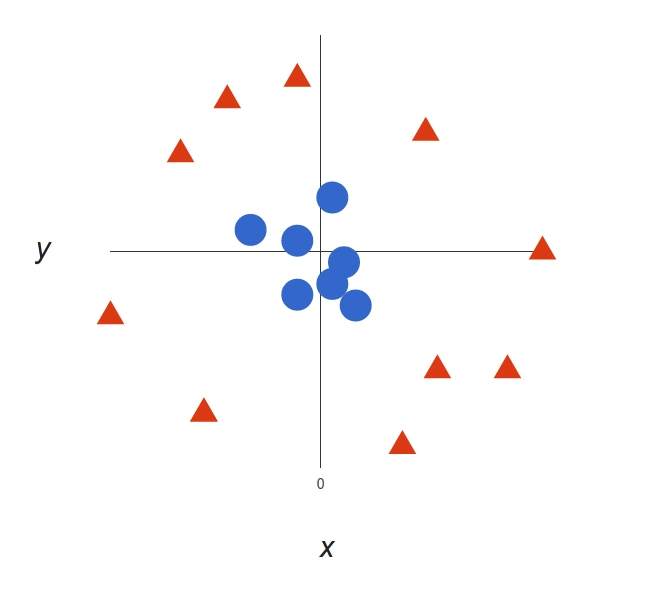
A more complex dataset
It’s pretty clear that there’s not a linear decision boundary (a single straight line that separates both tags). However, the vectors are very clearly segregated and it looks as though it should be easy to separate them.
So here’s what we’ll do: we will add a third dimension. Up until now we had two dimensions: x and y. We create a new z dimension, and we rule that it be calculated a certain way that is convenient for us: z = x² + y² (you’ll notice that’s the equation for a circle).
This will give us a three-dimensional space. Taking a slice of that space, it looks like this:

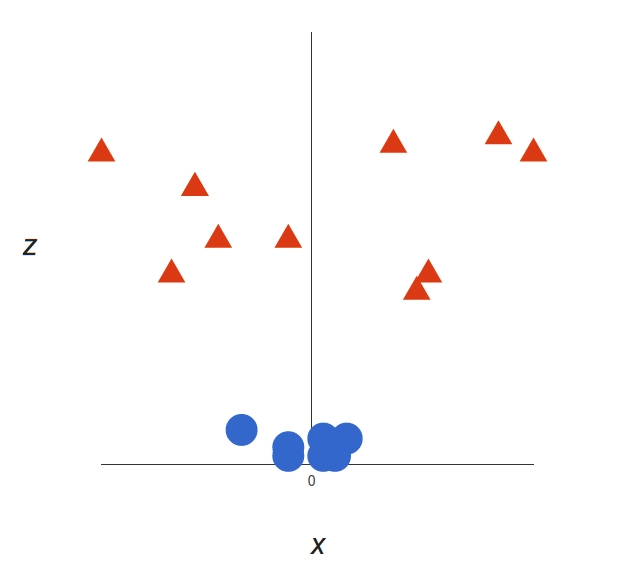
From a different perspective, the data is now in two linearly separated groups
What can SVM do with this? Let’s see:

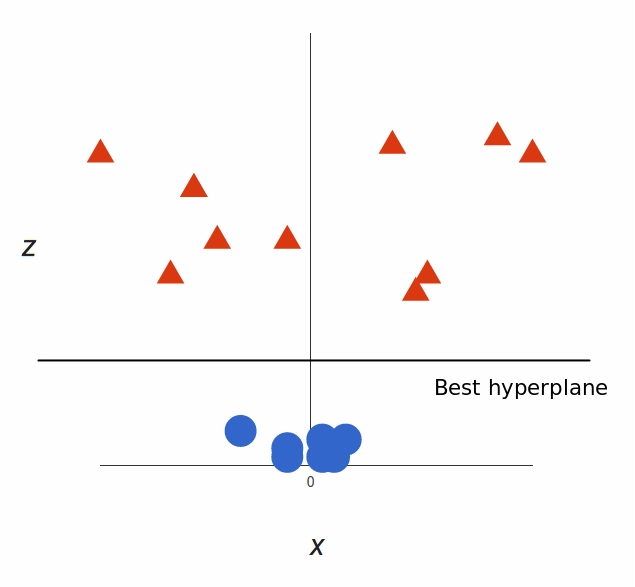
That’s great! Note that since we are in three dimensions now, the hyperplane is a plane parallel to the x axis at a certain z (let’s say z = 1).
What’s left is mapping it back to two dimensions:

Back to our original view, everything is now neatly separated
And there we go! Our decision boundary is a circumference of radius 1, which separates both tags using SVM. Check out this 3d visualization to see another example of the same effect:
The kernel trick
In our example we found a way to classify nonlinear data by cleverly mapping our space to a higher dimension. However, it turns out that calculating this transformation can get pretty computationally expensive: there can be a lot of new dimensions, each one of them possibly involving a complicated calculation. Doing this for every vector in the dataset can be a lot of work, so it’d be great if we could find a cheaper solution.
And we’re in luck! Here’s a trick: SVM doesn’t need the actual vectors to work its magic, it actually can get by only with the dot products between them. This means that we can sidestep the expensive calculations of the new dimensions.
This is what we do instead:
Imagine the new space we want:
z = x² + y²
Figure out what the dot product in that space looks like:
a · b = xa · xb + ya · yb + za · zb
a · b = xa · xb + ya · yb + (xa² + ya²) · (xb² + yb²)
Tell SVM to do its thing, but using the new dot product — we call this a kernel function.
That’s it! That’s the kernel trick, which allows us to sidestep a lot of expensive calculations. Normally, the kernel is linear, and we get a linear classifier. However, by using a nonlinear kernel (like above) we can get a nonlinear classifier without transforming the data at all: we only change the dot product to that of the space that we want and SVM will happily chug along.
Note that the kernel trick isn’t actually part of SVM. It can be used with other linear classifiers such as logistic regression. A support vector machine only takes care of finding the decision boundary.
Using SVM with Natural Language Classification
So, we can classify vectors in multidimensional space. Great! Now, we want to apply this algorithm for text classification, and the first thing we need is a way to transform a piece of text into a vector of numbers so we can run SVM with them. In other words, which features do we have to use in order to classify texts using SVM?
The most common answer is word frequencies, just like we did in Naive Bayes. This means that we treat a text as a bag of words, and for every word that appears in that bag we have a feature. The value of that feature will be how frequent that word is in the text.
This method boils down to just counting how many times every word appears in a text and dividing it by the total number of words. So in the sentence “All monkeys are primates but not all primates are monkeys” the word monkeys has a frequency of 2/10 = 0.2, and the word but has a frequency of 1/10 = 0.1 .
For a more advanced alternative for calculating frequencies, we can also use TF-IDF.
Now that we’ve done that, every text in our dataset is represented as a vector with thousands (or tens of thousands) of dimensions, every one representing the frequency of one of the words of the text. Perfect! This is what we feed to SVM for training. We can improve this by using preprocessing techniques, like stemming, removing stopwords, and using n-grams.
Choosing a kernel function
Now that we have the feature vectors, the only thing left to do is choosing a kernel function for our model. Every problem is different, and the kernel function depends on what the data looks like. In our example, our data was arranged in concentric circles, so we chose a kernel that matched those data points.
Taking that into account, what’s best for natural language processing? Do we need a nonlinear classifier? Or is the data linearly separable? It turns out that it’s best to stick to a linear kernel. Why?
Back in our example, we had two features. Some real uses of SVM in other fields may use tens or even hundreds of features. Meanwhile, NLP classifiers use thousands of features, since they can have up to one for every word that appears in the training data. This changes the problem a little bit: while using nonlinear kernels may be a good idea in other cases, having this many features will end up making nonlinear kernels overfit the data. Therefore, it’s best to just stick to a good old linear kernel, which actually results in the best performance in these cases.
Putting it all together
Now the only thing left to do is training! We have to take our set of labeled texts, convert them to vectors using word frequencies, and feed them to the algorithm — which will use our chosen kernel function — so it produces a model. Then, when we have a new unlabeled text that we want to classify, we convert it into a vector and give it to the model, which will output the tag of the text.
Simple SVM Classifier Tutorial
To create your own SVM classifier, without dabbling in vectors, kernels, and TF-IDF, you can use one of MonkeyLearn’s pre-built classification models to get started right away. It’s also easy to create your own, thanks to the platform's super intuitive user interface and no-code approach.
It’s also great for those who don’t want to invest large amounts of capital in hiring machine learning experts.
Let’s show you how easy it is to create your SVM classifier in 8 simple steps. Before you get started, you’ll need to sign up to MonkeyLearn for free.
1. Create a new classifier
Go to the dashboard, click on “Create a Model” and choose “Classifier”.


2. Select how you want to classify your data
We’re going to opt for a “Topic Classification” model to classify text based on topic, aspect or relevance.


3. Import your training data
Select and upload the data that you will use to train your model. Keep in mind that classifiers learn and get smarter as you feed it more training data. You can import data from CSV or Excel files.


4. Define the tags for your SVM classifier
It’s time to define your tags, which you’ll use to train your topic classifier. Add at least two tags to get started – you can always add more tags later.


5. Tag data to train your classifier
Start training your topic classifier by choosing tags for each example:


After manually tagging some examples, the classifier will start making predictions on its own. If you want your model to be more accurate, you’ll have to tag more examples to continue training your model.
The more data you tag, the smarter your model will be.
6. Set your algorithm to SVM
Go to settings and make sure you select the SVM algorithm in the advanced section.


7. Test Your Classifier
Now you can test your SVM classifier by clicking on “Run” > “Demo”. Write your own text and see how your model classifies the new data:


8. Integrate the topic classifier
You’ve trained your model to make accurate predictions when classifying text. Now it’s time to upload new data! There are three different ways to do this with MonkeyLearn:
Batch processing: go to “Run” > “Batch” and upload a CSV or Excel file. The classifier will analyze your data and send you a new file with the predictions.
API: use MonkeyLearn API to classify new data from anywhere.
Integrations: connect everyday apps to automatically import new text data into your classifier. Integrations such as Google Sheets, Zapier, and Zendesk can be used without having to type a single line of code:


Final words
And that’s the basics of Support Vector Machines!
To sum up:
- A support vector machine allows you to classify data that’s linearly separable.
- If it isn’t linearly separable, you can use the kernel trick to make it work.
- However, for text classification it’s better to just stick to a linear kernel.
With MLaaS tools like MonkeyLearn, it's extremely simple to implement SVM for text classification and get insights right away.
Create your own SVM classifier
Have questions? Schedule a demo and we'll help you get started.


Bruno Stecanella
June 22nd, 2017
Posts you might like...


Text Analysis with Machine Learning
Turn tweets, emails, documents, webpages and more into actionable data. Automate business processes and save hours of manual data processing.
Try MonkeyLearn


