The Ultimate Guide to Net Promoter Score Data

When it comes to the Net Promoter Score, or any customer service metric for that matter, your score is only as good as what you do with the data you get back.
When customers tell you what they expect from you, it’s in your best interest to analyze this information carefully to see where you can improve their experience. This might mean fixing pain points or even creating new products and services. Either way, listening to what your customers need will allow you to reduce churn.
The key to turning your NPS survey data into a gold mine of insights is to effectively analyze it for actionable information about your customers’ experience. Keep reading to learn what Net Promoter Score is and everything you need to know about analyzing your NPS data.
Feel free to jump ahead to the part that interests you the most:
What Is NPS?
Net Promoter Score (NPS) is a customer experience (CX) metric that shows how satisfied your customers are with your company. It is generally used to get an overall idea of your customers’ loyalty and to predict whether they will continue using your product or services in the future.
To get your score, a simple closed-ended question is asked to the customer. This is usually along the lines of:
“On a scale of 0-10, how likely are your to recommend our company to your friends and family?”
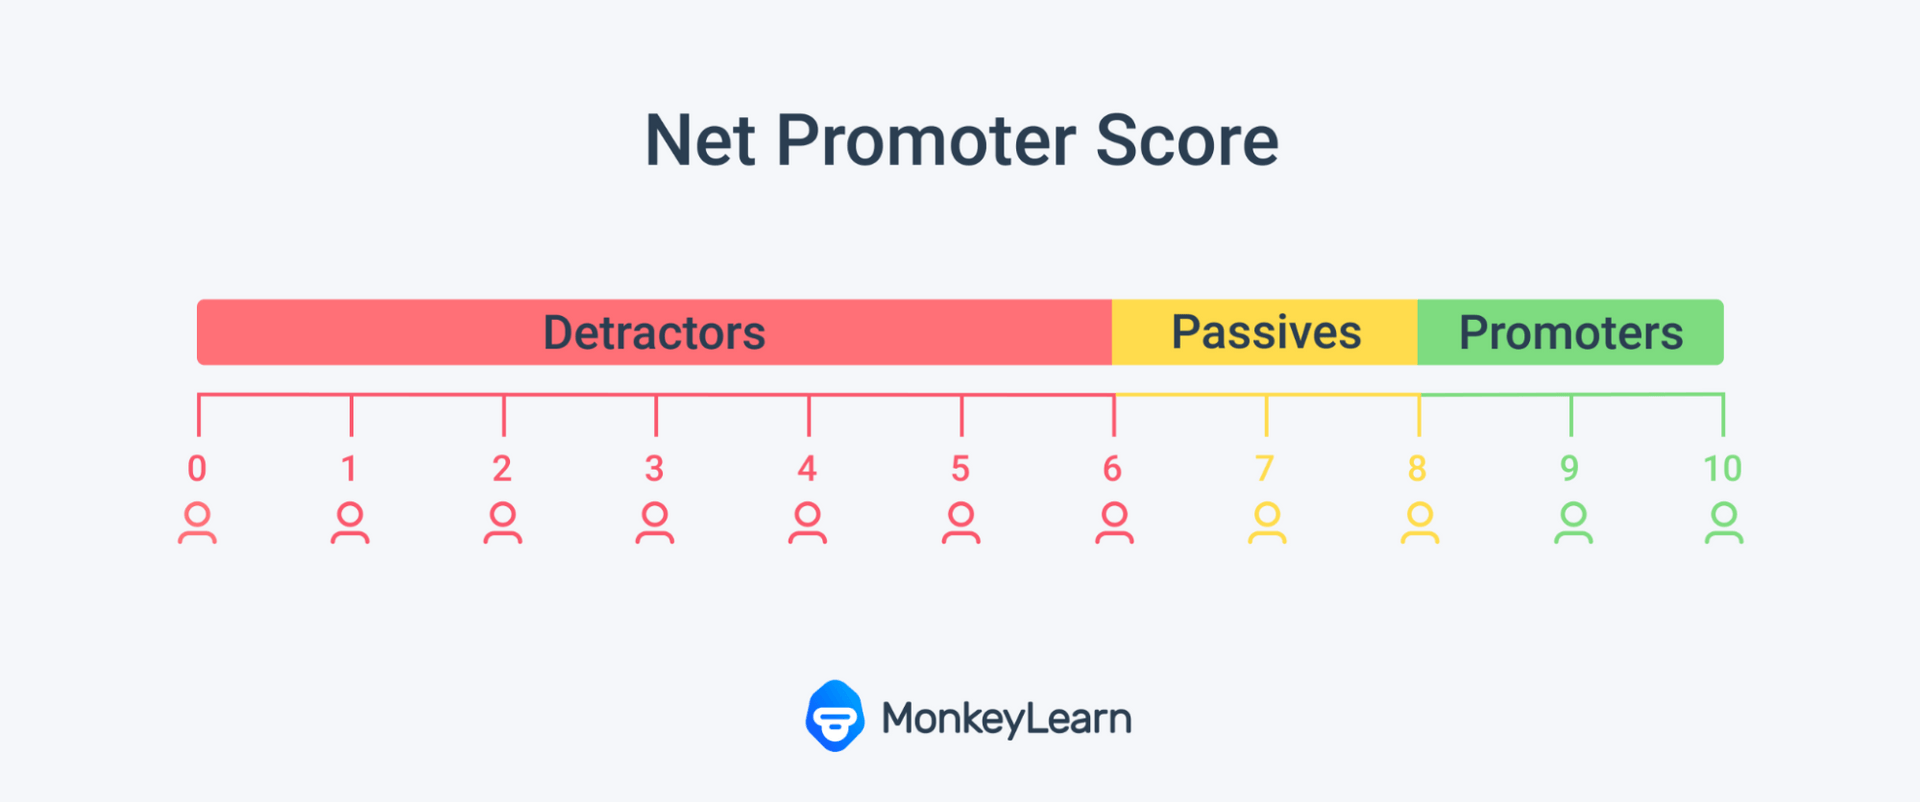
Once your customers have responded, they are then assigned one of the following three labels according to the rating they gave for the closed-ended question:

- Promoters, 9-10: These are your most loyal customers, ones who will recommend your to their contacts and return to your products and services time and time again.
- Passives, 7-8: These customers are neither loyal nor disloyal. However, they are unlikely to recommend you to their contacts and could easily jump to your competitor if they get a better deal.
- Detractors, 0-6: This group are unsatisfied and are likely to tell their acquaintances not to use your products and/or services.
It’s best practice to follow the closed-end question with an open-ended one. This gives your customers the opportunity to explain the reason behind their score, leaving you with qualitative data that you can mine for insights.
Why You Should Gather NPS Data
As we’ve seen, your NPS score can tell you how loyal your customer base is. Loyalty leads to retention, and studies have shown that existing customers are 50% more likely to try new products. They also, on average, spend more than new customers. Therefore, your NPS can be a good indicator of your potential growth.
In fact, research from Bain & Co (creators of the NPS) shows that companies who have high NPS within their industry for three or more years see revenue grow more than twice as fast as their peers.
The benefits of NPS are all there. Now, let’s take a look at how to get the most out of your NPS survey data.
NPS Data Analysis
How to calculate your NPS
To calculate your NPS you must first work out your percentage of promoters and of detractors. From there, it’s as easy as subtracting your percentage of detractors from promoters, as shown here:

While passives don’t figure into NPS calculation, they often have useful opinions that can be captured with an open-ended question. They are also closer to being promoters than detractors are, so they are easier to convert.
Let’s go through how to know if your score is good once you have calculated your NPS.
What Is a Good Net Promoter Score?
Figuring out what constitutes a good NPS score is not as straightforward as it may seem. NPS scores can vary greatly according to factors like industry, geographic location, and timing.
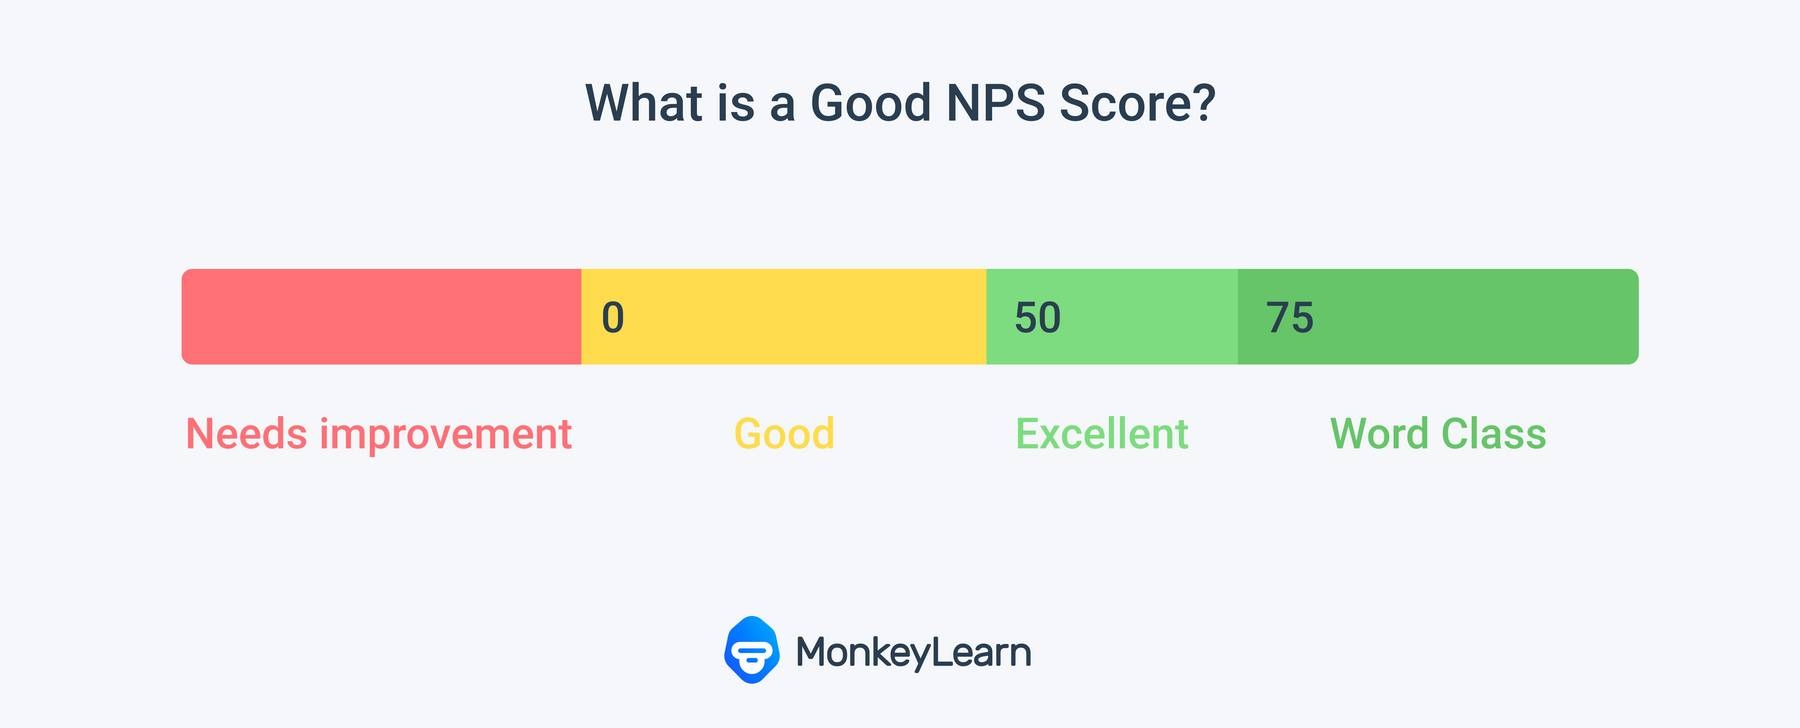
However, as a general guide, anything above a 0 is considered good, anything over 50 excellent, and anything over 75 world-class. Then, anything under 0 needs to be improved, as you have more detractors than promoters.

It’s worth noting that the best score to benchmark off of is your own score from previous surveys. Using your own score tells you if your score is improving and gives you a clear picture of whether the enhancements you’re making to your customer experience are working.
When to Conduct Your NPS Survey
In order to benchmark against your own score, you need to have a survey schedule. This might involve sending out your survey annually, bi-yearly or quarterly. When you send out your survey according to these types of timelines it’s best to choose neutral touch points to get an accurate overall impression of how your customers feel. This is known as relational NPS.
To get an NPS score that is tied to a particular process or touchpoint, you can send your survey directly following a specific transaction. Here you would need to tweak your NPS question slightly to ask whether they would recommend your company based on that particular transaction/touch point. This is known as transactional NPS.
Qualitative NPS Data Analysis
As we’ve mentioned, you should include an open-ended question in your NPS survey to collect qualitative data. Without this added information, the score customers give you lacks context.
When customers share with you exactly what they think, and what motivated them to choose the score they did, you can better identify any pain points. You can then use these insights to put in place measures to improve the customer experience.
It’s true though, that qualitative data is more difficult to analyze than quantitative data. Open-ended questions give you opinions, thoughts and feelings. These data points are not just numbers on a scale. This means you have to be smart when it comes to your data analysis.
How To Analyze Your NPS Data
So, what do you need to know when it comes to processing your data? First, it’s important to understand that manually processing is time-consuming and inefficient.
Human beings are subjective so having them sort through information related to customers' opinions will never result in objective insights. It's easy for people to make mistakes. It can even be an impossible task if the amount of data is too large.
This is where AI can be your best ally. With machine learning tools like MonkeyLearn you can analyze massive amounts of data automatically and for less money. It’s also much more accurate and objective than manual processing.
If you are just dipping your toes into the world of text analysis, word clouds are a nice place to start. They take your open-ended survey data and show you the most popular words and phrases that are cropping up, giving you a visual representation of your results. This allows you to easily spot any trends.
Here is an example of a word cloud created with our free word cloud generator:

Although word clouds are a great starting point for text analysis, to gain even deeper insights, you should use more advanced machine learning techniques. Here are a few to get you started:
Sentiment Analysis
Sentiment analysis is one of the most popular forms of text analysis. Sentiment analysis sifts through your raw text data and determines whether the text is positive, negative or neutral. Allowing you to learn if your customers are happy or frustrated, so you can make more informed decisions.
You can try out our demo model for sentiment analysis writing your own text below:
Text Classification
Text classification uses natural language processing (NLP) and machine learning to automatically assign a set of predefined categories to unstructured text. This way, you can easily identify what the customer is referring to in his open-ended answer and organize responses by topic or theme.
You can try our demo NPS classifier below, which sorts open-ended survey responses into the following categories: customer support, ease of use, features and pricing:
Aspect-based Sentiment Analysis
In the case of aspect-based sentiment analysis, you can link the sentiment to a particular aspect of your customers’ experience, for even deeper insights. Basically, you perform sentiment analysis and text classification to the same response to associate specific sentiments with different aspects of your business.
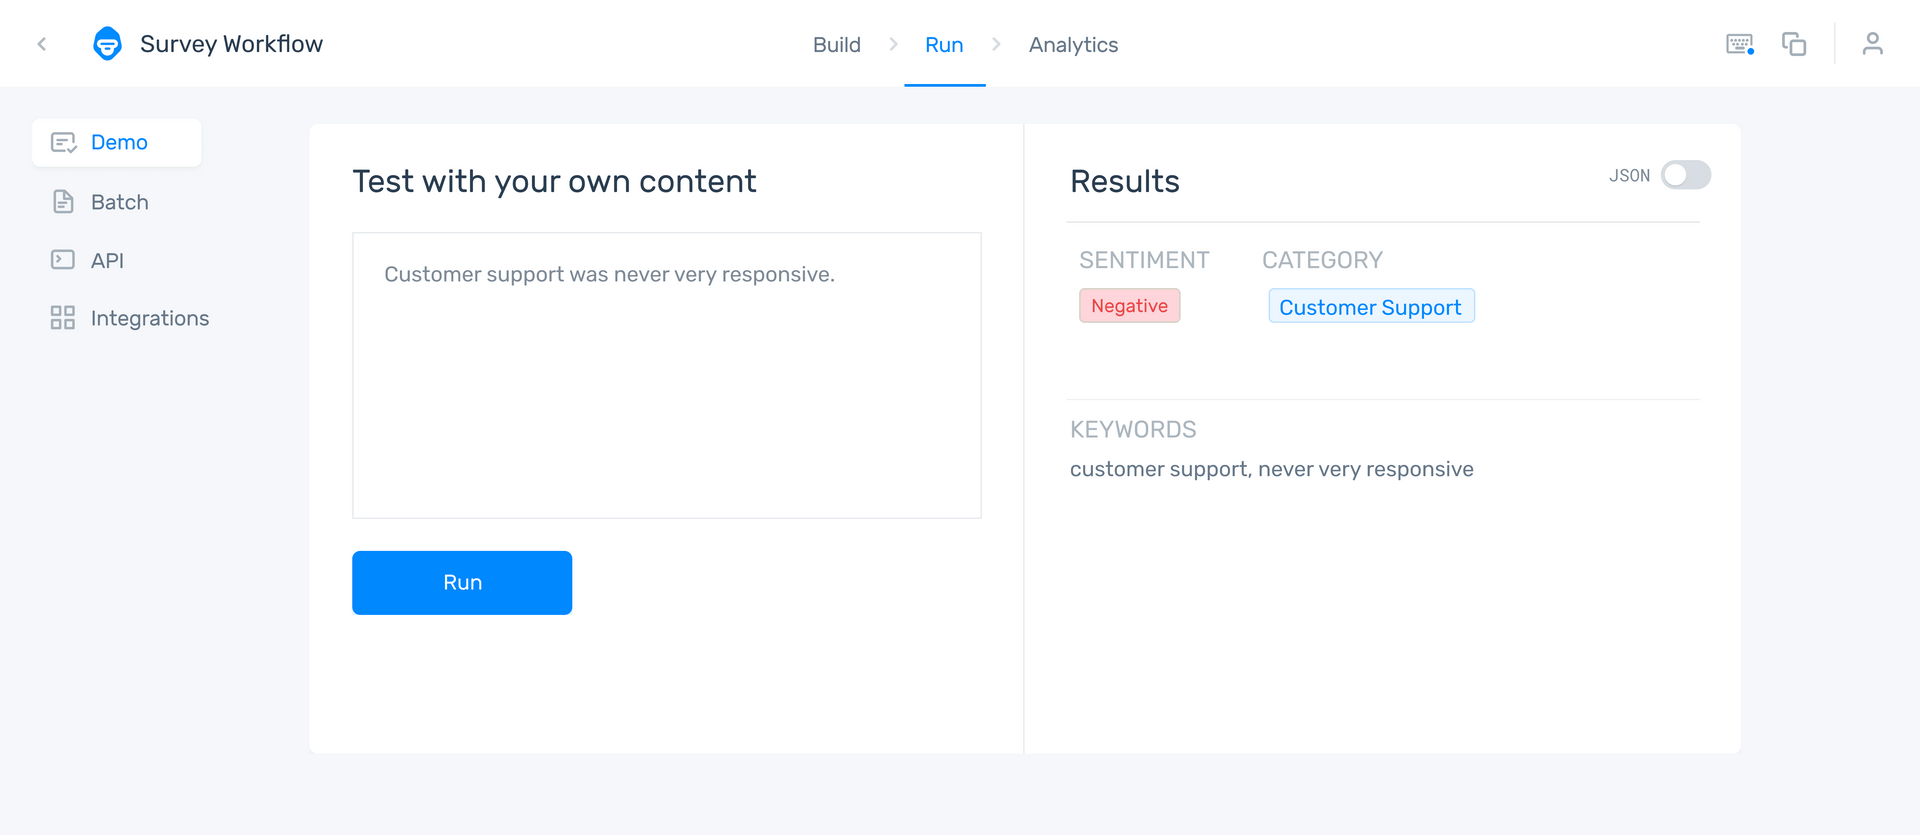
Here is an example of aspect-based sentiment analysis being applied to an open-ended survey response:

Using machine learning you can automatically detect that the customer has a negative sentiment towards your customer support.
Keyword Extraction
Keyword extraction is another great text analysis technique which uses natural language processing (NLP) to help you pull out the most important words from your NPS survey data. This allows you to easily spot what your customers are mentioning most often in their answers.
Try our demo keyword extractor below:
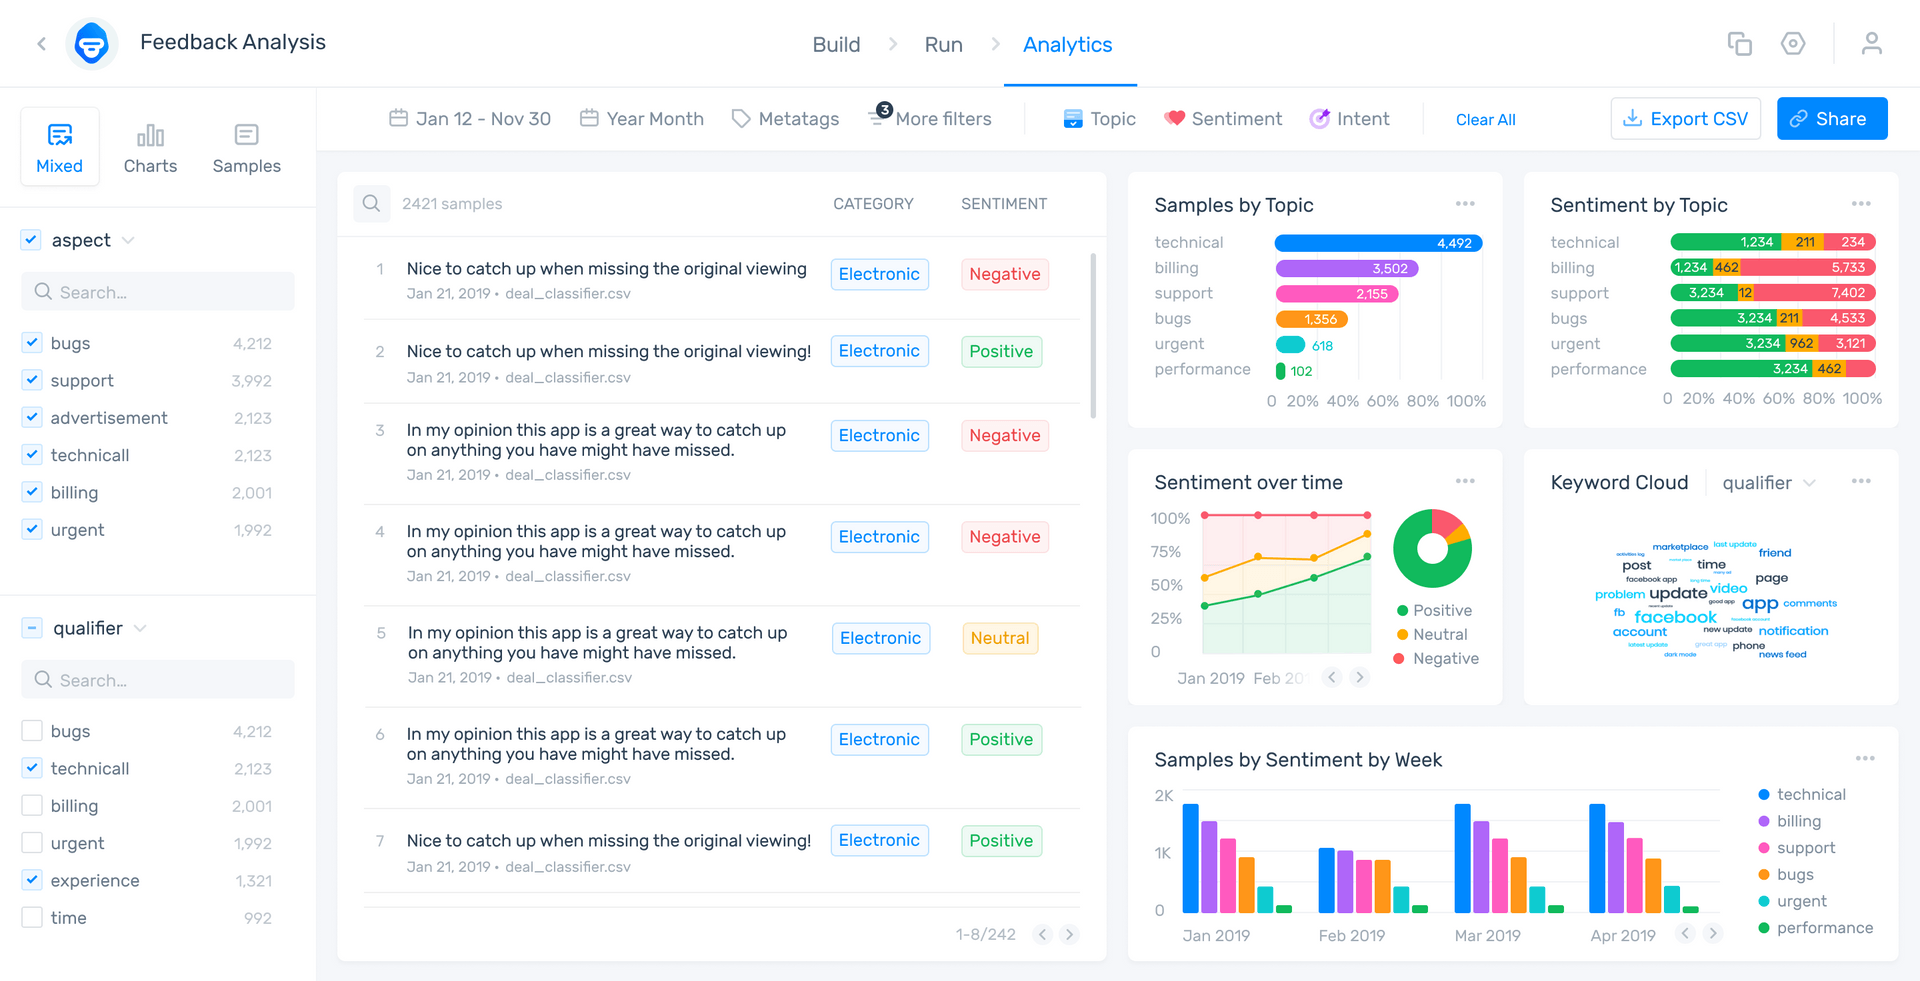
To maximize the power of these techniques, they are best used in conjunction with one another. MonkeyLearn Studio lets you perform in-depth, multi-faceted analysis using different AI tools all in one place. This is all done automatically, 24/7, and in real time. There is also an easy-to-read dashboard that displays all of your insights.
This public demo of the MonkeyLearn dashboard, also pictured below, gives you an idea of what it’s capable of:

Conclusion
NPS is the gold standard of customer service surveys. However, what really makes it powerful is the qualitative data that you get with an added open-ended question.
You need to have the right tools in place to efficiently analyze the data you get back from your NPS survey. When you have those insights, you can then put in place meaningful changes to your customer experience to help prevent churn and improve your bottom line.
Discover MonkeyLearn’s suite of text analysis tools by signing up for free, or schedule your free demo today.

Inés Roldós
August 5th, 2021


