

Sentiment analysis of Slack reviews using R


Contributed by Amanda Dobbyn, co-maintainer of MonkeyLearn R package.
Let's imagine that I'm the Slack team and I’m looking for an easy, reliable way to get data about users' feelings about my product. For example, which aspects of the product are the most beloved and which are the most hated ones? Are paid users getting a good value for money? What do people think about the customer support?
I can turn to Slack online reviews in order to answer some of these top-of-mind questions. But, when there are thousands of reviews out there, it can be tough to sort through all this feedback and get the insights I’m looking for. There is simply too much feedback to process manually.
This is where MonkeyLearn can come in handy. It’s a fantastic tool for performing sentiment analysis tailored to a particular use case. We can outsource the heavy lifting of analyzing all of this feedback to a machine learning model, so we can save time and help inform product decisions in a more efficient way.
With this in mind, I created this step-by-step guide, where I'll give an example of how you might use the monkeylearn R package to conduct a seamless sentiment analysis of consumer product reviews. I'll be analyzing a few thousand reviews of Slack on the product review site Capterra and get some great insights from the data. You can find the full analysis and source code on GitHub.
Read along or jump to the section that interests you the most:
- The Plan
- Scraping the reviews with R
- Creating Aspect and Sentiment Analysis Models
- Analyzing the Data using R
- Insights from the analysis
The Plan
Most of what we have to do is shunt data back and forth between our environment and MonkeyLearn's text analysis models.
The approach here will be to first scrape and tidy reviews and their associated ratings. Next, we'll feed each of the reviews to MonkeyLearn in order to extract discrete opinion units from the text. Finally, we'll use a custom-trained MonkeyLearn sentiment classifier to classify each opinion unit into its primary sentiment: Negative, Neutral, or Positive, as well as the aspect it fits into best (e.g., UI-UX, Pricing, Mobile, etc.) -- at 93% accuracy, at last count.
The opinion unit approach gives us some more fine-grained control over what we're assigning sentiment to, since there can be multiple sentiments in the same sentence. For instance, "I love Spring time but I hate the allergies that go along with it" would hopefully be broken into the units "I love Spring time" and "but I hate the allergies that go along with it" and assigned the sentiments Positive and Negative, respectively.
Then, we're left with a dataset of opinion units, each tagged with a sentiment as well as with one or many aspects that we can sink our teeth into.
Scraping the reviews from Capterra
First step is to collect all of the reviews of Slack that people have left on Capterra.
We'll want to make sure that the website we're considering allows for scraping. We can consult the robots.txt file that typically lives at the top level of a website with the handy robotstxt package:
library(here)
library(tidyverse)
library(rvest)
library(monkeylearn)
library(glue)
library(knitr)
library(dobtools)
library(tidytext)
library(kableExtra)


robotstxt::paths_allowed(
  domain = "capterra.com",
  path = "/",
  bot = "*"
)


## [1] TRUE
Now that we know we're good to go, we can start scraping Capterra. I'll use the popular package rvest to do the scraping. rvest allows us to ask for content that lives inside a specific HTML tag or CSS class rather than grabbing all text on the page. We can find out which elements on the page to extract using the SelectorGadget Chrome extension.
On Capterra, reviews are parceled into chunks including the reviewer's overall rating of the product, the text of their review, and what I'm calling sub-ratings --the ratings of certain aspects of the product, e.g. Customer Support, Ease of Use, and Value for Money. Like the overall rating, users have the option to give these aspects a rating from 1 to 5 out of 5:


A Slack review on Capterra.
We want each review's overall rating, all of its sub-ratings, and the content of the review.
We'll first store the URL where the Slack reviews appear, slack_url <- "https://www.capterra.com/p/135003/Slack/" and write quick helper for stripping out extra whitespace and newlines from our HTML soup:
strip_whitespace_newlines <- function(t) {
  out <- t %>%
    str_replace_all("\\n", " ") %>%
    trimws()

  return(out)
}
Grabbing multiple pages
Our slack_url loads 99 reviews of the total 4500+ at the time of scraping. To load more, the user would hit the "Show more reviews" button at the bottom of the page. This fetches more reviews from the server, but doesn't change the URL at all. That means that just using rvest and this URL without involving RSelenium or something more fancy, we can only scrape the first 99 reviews.
However, through a bit of investigation of the "Show more reviews" button in the Chrome inspector, I saw that inside the link's a tag is a data-url parameter set to "/gdm_reviews?page=1&product_id=135003" 1:


Exploring the "show more reviews" button
We can mash that together with our original URL to get https://www.capterra.com/gdm_reviews?page=1&product_id=135003 which reveals the same content our original URL (sans the styling). The page=1 query parameter in this URL, though, is key; it gives us a way to select a certain page by changing the number after page= .
Now we can construct the URLs for all the pages we want to iterate through. From a quick perusal of a few other pages, it looks like each one contains 99 reviews. We'll create URLs for the first 45, pages putting us at nearly the full content of our 4500 or so reviews:
pages_want <- 1:45
slack_full_urls <- str_c("https://www.capterra.com/gdm_reviews?page=", pages_want, "&product_id=135003", sep = "")
Defining some scraping functions
We can specify which of the 99 reviews on a page we want to scrape with from the review's number, contained in #review-<review_number_here> What scrape_rating will do is #review-{i} .overall-rating . We'll wrap the scrape_rating function in a trycatch so that we return an NA if something goes wrong rather than an error:
scrape_rating <- function(url, i) {
  out <- url %>%
    read_html() %>%
    html_nodes(glue("#review-{i} .overall-rating")) %>%
    html_text() %>%
    strip_whitespace_newlines()

  if (length(out) == 0) {
    out <- NA_character_
  }

  return(out)
}

try_scrape_rating <- possibly(scrape_rating, otherwise = NA_character_)
Same deal for content and sub-ratings except we use a different selector and concatenate all of the ratings with str_c(collapse = " ") for now. We'll break those out later into a nested list column.
We'll similarly wrap each of these in a trycatch:
try_scrape_sub_ratings <- possibly(scrape_sub_ratings, otherwise = NA_character_)
try_scrape_content <- possibly(scrape_content, otherwise = NA_character_)
Let's try asking for just the 42nd review on the first page:
try_scrape_content(slack_full_urls[1], 42)


## [1] "Pros:  It combines instant messaging and chat. Allows us to organize. It is really hard to describe how Slack works. You just have to do it.  Cons:  I would like to use the email features more but it seems expensive for a small step up. I know the paid plans do much more, but we won't use those.   Overall:  It is just a better way to work."
Combining scraping functions
Now all that's left is to string these all together in the right order inside a function, get_ratings_and_content , that grabs a vector of reviews from a single page. We can keep track of which page we're scraping by extracting it straight from the URL itself. (If we use the original Slack URL which doesn't contain a page number, the page value gets an NA .)
In each iteration, I go review by review here and grab both the rating and the review content before moving onto the next review to be absolutely sure that we're correctly matching rating and review. This approach is slower than grabbing all reviews and all ratings and matching them up afterward, but that could potentially get hairy if there are cases where we have more ratings than reviews on a page or vice versa. For fun we calculate a rating_perc which is the rating fraction string evaluated into its percent form (so "4/5" becomes 0.8).
Here we jitter the amount of wait time between each iteration using a uniform distribution around sleep, plus or minus half a second.
Throughout this post I'll be writing data out to small files in a directory so that if our loop fails somewhere along the way for any number of reasons, we won't lose all the data we've collected up to that point in the loop and can pick up again where we errored out on the first go-round. In this case, if we ask get_ratings_and_content to write what we've got so far, we create a new file in whatever write_path is set to:
get_ratings_and_content <- function(url, review_range = 1:50,
                                    sleep = 1,
                                    write_out = TRUE, write_path = data_dir) {
  ifelse(sleep <= 1, 1, sleep)

  out <- tibble()
  page <- ifelse(str_detect(url, "page"),
    qdapRegex::ex_between(url, "page=", "&")[[1]],
    NA_character_
  )

  for (i in review_range) {
    message(glue("Beginning scrape of page {page}, review {i}"))

    this_rating <- try_scrape_rating(url, i)
    this_sub_ratings <- try_scrape_sub_ratings(url, i)
    this_cont <- try_scrape_content(url, i)

    this_review <- tibble(
      rating = this_rating,
      sub_ratings = this_sub_ratings,
      content = this_cont,
      page_num = page,
      review_num = i
    )

    if (write_out == TRUE) {
      write_rds(this_review, path = glue(data_dir, "page_{page}_rating_{i}.rds"))
    }

    out <- out %>%
      bind_rows(this_review)

    Sys.sleep(runif(1, sleep - 0.5, sleep + 0.5))
  }

  out <- out %>%
    rowwise() %>%
    mutate(
      rating_perc = ifelse(is.na(rating), NA_real_,
        parse(text = rating) %>% eval()
      )
    ) %>%
    select(page_num, review_num, rating, sub_ratings, rating_perc, content)

  return(out)
}
Let's give it a go with the first two reviews on the 10th page:
get_ratings_and_content(
  url = slack_full_urls[10],
  review_range = 1:2
) %>%
  add_kable()
| 10 | 1 | 5/5 | 5 / 5 Ease of Use 5 / 5 Features & Functionality | 1.0 | Pros: As a small team, Slack is perfect to host our communications: our conversations are sorted through dedicated channels, we can use the Search functionnality to find old messages and the best part: we can react to a message using emoji!!!!! Also, I use a lot the "Reminder" option to make sure I never forget a task. Cons: The notifications in Threads definitely need to be improved since it's really easy to miss one at the moment. |
| 10 | 2 | 4/5 | 4 / 5 Ease of Use 4 / 5 Features & Functionality 4 / 5 Customer Support 4 / 5 Value for Money | 0.8 | Comments: In general I really love Slack, and I am still learning about all it has to offer. Pros: The software is extremely intuitive right from the start. I didn't really need to go through the built-in tutorial. Having used any chat platform before, Slack is quick to get comfortable with and I found myself getting into a lot of the features the first day of use. Now that I have used it for a little while, I wouldn't want to be without it as it is an excellent company-wide resource. Cons: The only thing that I would improve would be the intuitiveness of the plug-in's. It might be the case that Slack just needs to pay a bit more attention to the quality and ease of use of the plug-in's. |
Grabbing multiple pages
Now that we can grab everything we want from a single page, let's wrap get_ratings_and_content up into something that iterates through multiple pages. The maximum number of reviews on a page is 99, so we'll set our default review_range to that.
In get_ratings_and_content we included the page and rating number in the review file name as its unique identifier. get_multiple_pages will write our results out to our same data directory:
get_multiple_pages <- function(urls, review_range = 1:99, ...) {
  out <- tibble()
  for (u in urls) {
    this_page <- get_ratings_and_content(u, review_range = review_range, ...)
    out <- out %>%
      bind_rows(this_page)
  }
  return(out)
}
Let's scrape all of the pages!
all_reviews_slack <-
  slack_full_urls %>%
  get_multiple_pages()
And now we can check out what we've got:
all_reviews_slack %>%
  head() %>%
  add_kable()
| Rating | Sub Ratings | Content | Review Num | Page Num |
|---|---|---|---|---|
| 5/5 | 5 / 5 Ease of Use 5 / 5 Features & Functionality 5 / 5 Customer Support 5 / 5 Value for Money | Pros: Ability to create groups, project rooms and add/assign people to these groups. It helps improve coordination among team members Cons: Since it is intended to be used by professionals, most of the professionals are using outlook and they already receive reminders for tasks and meetings, additional notifications from Meekan are unnecessary Overall: Team collaboration, internal correspondence, documents sharing | 1 | 1 |
| 5/5 | 5 / 5 Ease of Use 5 / 5 Features & Functionality | Pros: I work across several workspaces and switching is super easy. I enjoy using Slack also because of how much work you can get done instead of constantly calling. Cons: The only issue I have is that the software limits your storage and sometimes it's really hard to send files over as you have a limit. But for more storage you need to pay up. No problem with it though. Overall: Flawless communications. | 1 | 2 |
Since we saved all of these to their own files, we could also read them all in from our directory and reconstitute the dataframe:
make_files <- function(page_range) {
  a <- glue(data_dir, "page_{page_range}")
  out <- NULL

  for (i in page_range) {
    b <- c(a %>% map_chr(str_c, "_rating_", i, ".rds", sep = ""))
    out <- c(out, b)
  }
  return(out)
}

fls <- make_files(page_range = pages_want)

all_reviews_slack <-
  map_dfr(fls, read_rds) %>%
  unnest(page_num) %>%
  drop_na(content)
Cleaning our data and preprocessing
We've got data! Next a few quick cleaning steps. Our review content often represents newlines by including a lot of extra whitespace. We'll clean_content by cleaning out multiple spaces:
clean_content <- function(t) {
  out <- t %>%
    t() %>%
    str_replace_all("[ ]{2,}", "")

  return(out)
}
Tidying subratings
Now let's clean up our sub-ratings. When we scraped sub-ratings we concatenated all of them into one long string because there wasn't a selector for each individual subrating. We want to split sub-ratings up into their own rows; for each long string, we'll extract all numbers and the corresponding name of the sub-rating the rating number belongs to (e.g. Value for Money 5/5) into a dataframe representing the same information in tidy format. We'll nest these in their own list column for later unnesting if we so choose. Rows without any sub-ratings get the appropriate NAs in both columns.
If something goes wrong and there are more sub-rating numbers than names or vice versa, we'll alert ourselves of this by returning a tibble that just says "length_mismatch":
split_subratings <- function(inp) {
  if (is.na(inp)) {
    out <- tibble(subrating_title = NA_character_, subrating_rating = NA_character_)
    return(out)
  }

  subrating_rating <- inp %>%
    str_extract_all("([0-9 ]+\\/[0-9 ]+)") %>%
    map(str_replace_all, "[ ]+", "") %>%
    as_vector()
  subrating_rating <- subrating_rating[subrating_rating != ""]

  subrating_title <- inp %>%
    str_split("([0-9\\. ]+\\/[0-9 ]+)") %>%
    as_vector()
  subrating_title <- subrating_title[subrating_title != ""]

  if (length(subrating_rating) != length(subrating_title)) {
    out <- tibble(subrating_title = "length_mismatch", subrating_rating = "length_mismatch")
    return(out)
  }

  out <- tibble(subrating_title = subrating_title, subrating_rating = subrating_rating)
  return(out)
}
Now we can take our raw reviews and get each sub-rating into a nested dataframe inside a new sub_ratings_splitcolumn, which can then be unnested:
reviews_with_subratings <- all_reviews_slack %>%
  rowwise() %>%
  mutate(
    sub_ratings_split = split_subratings(sub_ratings) %>% list()
  ) %>%
  select(-sub_ratings) %>%
  drop_na(content) %>%
  filter(!content %in% c("", " ")) %>%
  mutate(
    page_num = as.numeric(page_num)
  )

reviews_with_subratings_unnested <-
  reviews_with_subratings %>%
  unnest() %>%
  rename(
    sub_rating_category = names,
    sub_rating_rating = nums
  ) %>%
  arrange(page_num, review_num, sub_rating_category)
Let's take a peek at the data:
reviews_with_subratings_unnested %>%
  slice(1:3) %>%
  add_kable(add_scrollbox = TRUE)
| 5/5 | Pros: Ability to create groups, project rooms and add/assign people to these groups. It helps improve coordination among team members Cons: Since it is intended to be used by professionals, most of the professionals are using outlook and they already receive reminders for tasks and meetings, additional notifications from Meekan are unnecessary Overall: Team collaboration, internal correspondence, documents sharing | 1 | 1 | Customer Support | 5/5 |
| 5/5 | Pros: Ability to create groups, project rooms and add/assign people to these groups. It helps improve coordination among team members Cons: Since it is intended to be used by professionals, most of the professionals are using outlook and they already receive reminders for tasks and meetings, additional notifications from Meekan are unnecessary Overall: Team collaboration, internal correspondence, documents sharing | 1 | 1 | Ease of Use | 5/5 |
| 5/5 | Pros: Ability to create groups, project rooms and add/assign people to these groups. It helps improve coordination among team members Cons: Since it is intended to be used by professionals, most of the professionals are using outlook and they already receive reminders for tasks and meetings, additional notifications from Meekan are unnecessary Overall: Team collaboration, internal correspondence, documents sharing | 1 | 1 | Features & Functionality | 5/5 |
Cool so in the _nested version of our data we've got one row per review with a nested sub_ratings_split column, and in the _unnested version we've got as many rows per review as there are sub-ratings. We can still tell which review they each belong to because each has a unique page_num and review_num combination.
Now onto the text analysis! This is where MonkeyLearn comes in. They make it simple to analyze text at scale with machine learning using extraction or classification models. You can use pre-trained and ready to use models for general tasks or you can build a custom model for your own needs.
In our case, we’ll train 2 models for doing aspect-based sentiment analysis on the Slack reviews we just scraped that will help us get insights from the data and save time.
Creating aspect and sentiment analysis models on MonkeyLearn
In order to create good aspect and sentiment analysis models that will help us sort through these reviews automatically, we’ll have to define the task at hand.
Aspect classifiers will help you detect what the texts in the reviews talk about (e.g. pricing, UX, customer support, performance, integrations, etc.). So, before sinking your teeth into building a model, you will first have to define a set of tags that will account for most of the topics or aspects included in the Slack reviews.
When defining tags for the first time, it’s recommended to limit the number of tags as much as possible. It's best to work with fewer than 10, at least initially. Remember, you can make changes and add more tags to the model later. Also, for best results try to avoid situations where one tag might be confused with another one. After coming up with the tags, we’ll have to create a new model on MonkeyLearn, upload our dataset with reviews we just scraped and define the tags on the platform:


Defining tags on the Aspect Classifier
Now, we’ll need to tag some samples with the tags we have created to create a training dataset:
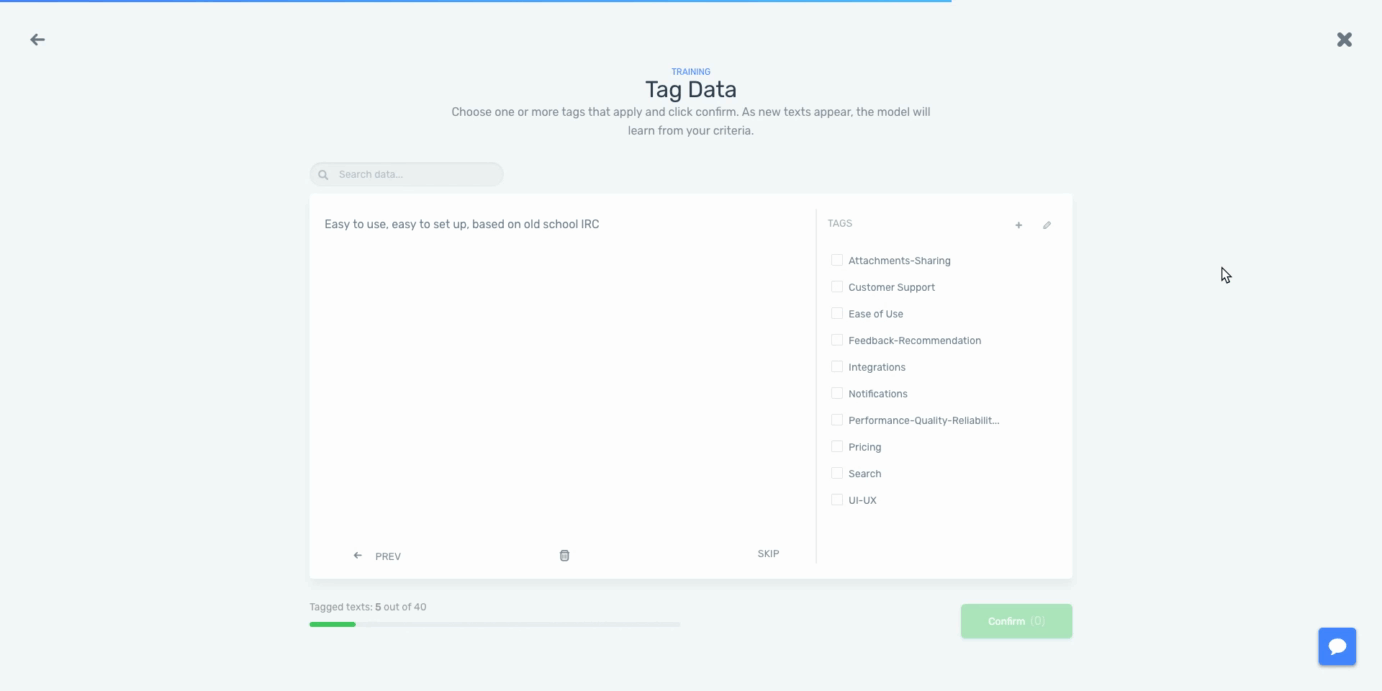
By tagging the text data, we’ll be teaching the machine learning algorithm that for a particular input (reviews), we expect a particular output (tags). The more data we tag, the better the model will work. Once we are happy with the predictions made by the model, it’s ready to be used to analyze all of our data.
Sentiment analysis models are a little bit more difficult to create.
The one good thing about creating custom sentiment analysis models is that you won’t have to think about the initial tags -- they are most likely to be the standard positive, neutral, and negative.
However, you will have to spend some time preprocessing your text data as it’s quite common to find reviews that have multiple sentiments in the same paragraph or even in the same sentence. For example, "Super easy to use, although a little bit pricey" has a positive sentiment in the first part of the sentence (“super easy to use”) and a negative sentiment in the last part (“although a little bit pricey”).
MonkeyLearn’s opinion unit extractor can help us split the Slack reviews into smaller bits of text in order to make it easier for the classifier to understand the sentiment in our texts. Moreover, since most reviews include more than one sentiment, as we’ve said before, splitting longer texts into smaller bits can help us detect different sentiments and aggregate them later on when we analyze all of the data.
So, for creating a sentiment analysis model, you should first submit the reviews to the extractor and then upload the opinion units we get to a new model on MonkeyLearn. Then, you will have to tag some samples as positive, negative, or neutral. Sentiment analysis is a much harder problem to solve than aspect classification, so it may need more training data.
And that’s it! You should have your models up and running on MonkeyLearn, ready for analyzing our reviews.
Aspect-based sentiment analysis in R
So, the first step to analyze all of the Slack reviews with the machine learning models we just created is to extract opinion units. Each review will have one or many opinion units. What we want to end up with is one row per opinion unit, meaning multiple rows per original content line.
Next, we send each opinion unit to the API to run the aspect-based sentiment analysis using R; this assigns a single sentiment (Positive, Negative, or Neutral) and classifies into one or multiple aspects.
The monkeylearn R package can get us most of the way there. monkeylearn exposes two functions for processing data: monkey_extract for extraction and monkey_classify for classification. They accept either a vector of texts or a dataframe and a named column where the texts live and return a dataframe relating each row of input to its outputs (either nested in a res column or unnested if unnest is TRUE). If unnested, that result will include a few columns including the extraction/classification label as well as the confidence MonkeyLearn assigns to each classification. We also need to supply an API key either as a string or (preferably) stored as an environment variable.
By using MonkeyLearn, it is possible to send batches of texts to the API and return a dataframe relating each input to its (often) multiple outputs. We don't need to handle batching ourselves; MonkeyLearn will by default send 200 texts per batch (the recommended maximum number of texts to be sent to the API at once) and move onto the next batch of 200 until we get to the end of our input. Similarly, MonkeyLearn already takes care of rate limiting, so we don't need to put in any custom sleeps between requests ourselves.
Tweaking the API response
Since we're working with custom-trained classifiers, the API response is slightly different from responses that the package is set up to handle. In particular, the package's handling of NULL values doesn't extend perfectly to this extractor and classifier, so we'll need to do a little finessing to change the missing values into values that we can unnest correctly. For that reason, we'll set unnest to FALSE inside of monkey_extract and monkey_classify and do the unnesting ourselves.
If we get a NULL response from our classifier we'll replace it with replacement_classifier and likewise for replacement_extractor :
replacement_classifier <- tribble(
  ~category_id, ~probability, ~label,
  NA_character_, NA_character_, NA_character_
) %>% list()


replacement_extractor <- tribble(
  ~count, ~tag, ~entity,
  NA_character_, NA_character_, NA_character_
)
We'll use these replacements inside the unnesting helpers below. They're different because of slightly different particularities to the API response. dobtools::replace_x is just a generic "replace this NULL or 0L vector with whatever replacement I specify" function that is often useful for turning NULL s in API response data into NA s so that nested values can be unnested and tidied properly. (Incidentally, this was developed before the first version of the rOpenSci roomba package was released, which could have proved useful for tasks like this.)
unnest_result_classifier <- function(df) {
  out <- df %>%
    rowwise() %>%
    mutate(
      res = ifelse(length(res)[[1]] == 0 || is.na(res), replacement_classifier, res)
    ) %>%
    unnest(res)

  return(out)
}

unnest_result_extractor <- function(df) {
  out <- df
  df$res <- df$res %>%
    map(dobtools::replace_x, replacement = replacement_extractor)

  out <- df %>%
    unnest(res)

  return(out)
}

try_unnest_result_extractor <- safely(unnest_result_extractor)
try_unnest_result_classifier <- safely(unnest_result_classifier)
We wrap the usual monkeylearn package functions monkeyclassify and monkey_extract in a trycatch using purrr::safely which returns a list of two things, one of which is always NULL ; the result of the function and an error. If the function fails, we get the error and a NULL response and if it succeeds we get the response and a NULL error. We put this precaution in place because our monkey function could throw an error for a few reasons; our request to MonkeyLearn could fail because either we or the server loses network connectivity, we receive a response we didn't expect and try to perform some operation on it that fails, or for some other unforeseen reason:
get_classification_batch <-
  safely(monkey_classify)

get_extraction_batch <-
  safely(monkey_extract)
Let's test what happens something fails:
safe_return <-
  NULL %>%
  get_classification_batch()

safe_return


## $result
## NULL
##
## $error
## <simpleError in .f(...): input must be non-null.>
The function executes successfully and we get a record of the error message.
Batching input to the MonkeyLearn API
Now a function wrap-up monkeyclassify and monkey_extract . Rather than writing one extraction wrapper and one classifier wrapper, I combined them both into the same function below. We supply an id which can be either an extractor ID or a classifier ID set type_of_problem to either "classification " or "extraction " depending on the ID. (All classifier IDs begin with "cl" and all extractor IDs begin with "ex_" ).
If any errors occur when we send text to the API, we log them in an error log that specifies where the error occurred and return that log along with the full response.
We'll take the same tack of storing each of these results in its own file (this time a CSV) in a user-specified directory:
write_batches <- function(df, id, dir,
                          n_texts_per_batch,
                          start_row = 1,
                          unnest = FALSE,
                          write_out = TRUE, ...) {
  if (substr(id, 1, 3) == "cl_") {
    type_of_problem <- "classification"
  } else if (substr(id, 1, 3) == "ex_") {
    type_of_problem <- "extraction"
  } else {
    stop("Not a recognized classifier or extractor id.")
  }

  resp <- tibble()
  n_df_rows <- nrow(df)

  batch_start_row <- start_row
  batch_end_row <- batch_start_row + n_texts_per_batch

  error_log <- ""

  while (batch_start_row <= n_df_rows) {
    if (type_of_problem == "classification") {
      this_batch_nested <- get_classification_batch(df[batch_start_row:batch_end_row, ],
        col = content,
        classifier_id = id,
        unnest = unnest
      )
      this_batch <- this_batch_nested$result %>%
        try_unnest_result_classifier()
    } else if (type_of_problem == "extraction") {
      this_batch_nested <- get_extraction_batch(df[batch_start_row:batch_end_row, ],
        col = content,
        extactor_id = id,
        unnest = unnest
      )

      this_batch <- this_batch_nested$result %>%
        try_unnest_result_extractor()
    }

    message(glue("Processed rows {batch_start_row} to {batch_end_row}."))

    if (is.null(this_batch_nested$error) && is.null(this_batch$error)) {
      if (write_out == TRUE) {
        write_csv(
          this_batch$result,
          glue("{dir}/{type_of_problem}_batches_rows_{batch_start_row}_to_{batch_end_row}.csv")
        )
      }

      resp <- resp %>%
        bind_rows(this_batch$result)
    } else {
      error_log <- error_log %>%
        c(glue("Error between rows {batch_start_row} and {batch_end_row}:
               {c(this_batch_nested$error, this_batch$error)}"))

      message(error_log)
    }

    batch_start_row <- batch_start_row + n_texts_per_batch
    batch_end_row <- batch_start_row + n_texts_per_batch

    if (batch_end_row > n_df_rows) {
      batch_end_row <- n_df_rows
    }
  }

  out <- list(
    resp = resp,
    error_log = error_log
  )

  return(out)
}
We can wrap write_batches in a couple helper functions with extraction- or classification-relevant results so that we don't need to specify them every time:
write_extraction_batches <- function(df, n_texts_per_batch = 200,
                                     dir = opinion_batches_dir, ...) {
  write_batches(df,
    id = extractor_id, n_texts_per_batch = n_texts_per_batch,
    dir = dir, ...
  )
}

write_classification_batches <- function(df, n_texts_per_batch = 200,
                                         dir = topic_batches_dir, ...) {
  write_batches(df,
    id = topic_id, n_texts_per_batch = n_texts_per_batch,
    dir = dir, ...
  )
}
For example:
reviews_with_subratings_nested[123, ] %>%
  write_extraction_batches(n_texts_per_batch = 1, write_out = FALSE) %>%
  write_classification_batches(n_texts_per_batch = 1, write_out = FALSE)
After we write all the results to their individual files, we'll want an easy way to gather up all of our result files up into a single dataframe. gather_batches will take a directory, create a vector of all the files that exist in it, read_csv in all of those files into one long list of dataframes, and then index into every element in that list to bind all of the dataframes together, row-wise:
Sending text the API and gathering it all up again
Cool, now we've set up everything we need to process our data and reconstitute the result. As a quick refresher, the flow here is that we'll take our scraped data, send it to the extractor to extract multiple opinion units per review, and then send each of those opinion units to the classifier to receive its sentiment rating and multiple aspect classifications per opinion unit:
# Write opinion units
reviews_with_subratings_nested %>%
  write_extraction_batches()

# Gather opinion units
opinion_batches_extracted <-
  gather_batches(dir = opinion_batches_dir) %>%
  rename(probability_unit = probability)

# Classify opinion units
opinion_batches_extracted %>%
  write_classification_batches()

# Gather classifications
dat <-
  gather_batches(dir = topic_batches_dir) %>%
  rename(probability_sentiment = probability)
We could even have skipped the gatherbatches steps if everything went well with our write{}_batches functions. Assigning that output to a variable also allows us to inspect the error_log to see if all went well.
Results of the Analysis
We've got the analysis! ???? Let's take a look at it:
dat %>%
  slice(1:50) %>%
  add_kable(capitalize = FALSE, add_scrollbox = TRUE)
(You can see a sample of the results here).
Since there are multiple rows per review, we'll want a unique identifier for each review. Each page_num , review_num combination represents a unique review. We could hash these two values but since we have the benefit of knowing that the reviews happen in chronological order, it seems better to number them, starting with 1 for our oldest review.
For good measure, I also created a doc_identifier by smushing together the page and review number:
dat <- dat %>%
  mutate(
    doc_identifier = str_c("r", review_num, "p", page_num, sep = "_")
  )

uuids <- dat %>%
  arrange(page_num, review_num) %>%
  nest(-doc_identifier) %>%
  mutate(doc_uuid = nrow(.) - row_number() + 1) %>%
  select(-data)

dat <- dat %>%
  left_join(uuids)
There are only three possible sentiments for an opinion unit to have:
dat$sentiment %>% factor() %>% levels()


## [1] "Negative" "Neutral"  "Positive"
So, we can assign a number to each type of sentiment in order to be able to represent them on an ordinal scale:
dat <- dat %>%
  rowwise() %>%
  mutate(
    sentiment_num = switch(sentiment,
      "Negative" = -1,
      "Neutral" = 0,
      "Positive" = 1
    )
  ) %>%
  ungroup()
What about aspects?
dat$category %>% factor() %>% levels()


##  [1] "Attachments-Sharing"             "Calls"
##  [3] "Channels"                        "Customer Support"
##  [5] "Desktop"                         "Ease of Use"
##  [7] "Emojis"                          "Feedback-Recommendation"
##  [9] "General"                         "Groups"
## [11] "Integrations"                    "Messages"
## [13] "Mobile"                          "None"
## [15] "Notifications"                   "Other"
## [17] "Performance-Quality-Reliability" "Pricing"
## [19] "Purpose"                         "Search"
## [21] "UI-UX"                           "Web"
We can see there are some opinion units labeled with the category "None". It's tough to know how to interpret these, so we can filter out these rows in a new dat_clean dataframe. We'll also filter out low-confidence sentiments and aspects -- anything that the classifier is less than 55% sure is classified correctly:
probability_cutoff <- 0.55

dat_clean <-
  dat %>%
  filter(!is.na(probability_unit) & !is.na(probability_unit) &
    category != "None" &
    probability_sentiment > probability_cutoff & probability_unit > probability_cutoff)
Insights from the analysis
After cleaning, we've got 2314 unique opinion units to work with, each with a single sentiment and multiple aspect classifications.
Overall sentiment breakdown
Now let's get the lay of the land by seeing what the breakdown of sentiments is overall:
sentiment_breakdown <-
  dat_clean %>%
  group_by(sentiment) %>%
  count() %>%
  rename(by_sentiment = n) %>%
  ungroup() %>%
  mutate(
    total = sum(by_sentiment),
    sentiment_prop = by_sentiment / total
  )


Overall sentiment breakdown
We can see there are very few reviews that have a neutral sentiment, which is useful for us. It's easier to draw conclusions about the strengths and weaknesses of a product when most of the feedback is either definitely positive or negative. (That could also be a reflection of the tendency of reviewers to feel more strongly about the product they're reviewing than the general user base. But whether or not these reviews are an unbiased reflection of most users' true feelings about the product is neither here nor there ????.)
Sentiment on overall ratings
We might ask how users' overall ratings of the product line up with sentiments assigned to each opinion unit by MonkeyLearn.
It's important to remember that there is a one-to-many relationship between ratings and opinion units here; each review gets a single rating, but reviews are later parceled into multiple opinions:
ratings_by_sentiment <-
  dat_clean %>%
  distinct(doc_uuid, .keep_all = TRUE) %>%
  group_by(sentiment) %>%
  summarise(
    mean_rating = mean(rating_perc, na.rm = TRUE)
  )

ratings_by_sentiment %>%
  add_kable()
| Positive | 0.94 |
| Neutral | 0.96 |
| Negative | 0.93 |
There is very little difference in overall ratings of the product across opinion unit sentiments. This indicates that despite criticism (which people are encouraged to think of and express in the Cons section), most overall reviews remain positive.
Aspect-based sentiment analysis
What is the interaction between the two main things of interest here, namely, aspect and sentiment? Let's get a summary of the mean sentiment (based off of our numerical representation of sentiment) for opinion units that have been classified into each aspect:
sentiment_by_category <-
  dat_clean %>%
  group_by(category) %>%
  summarise(
    mean_sentiment = mean(sentiment_num)
  ) %>%
  arrange(desc(mean_sentiment))
Next, I want to split these mean sentiment ratings into three equal parts and assign those parts valences that describe the mean sentiment for that aspect. We'll find the tertiles (a word I thought I made up but turns out it's a thing) of the mean sentiments so we can divide them in three groups as they relate to each other:
tertiles <- c(
    sentiment_by_category$mean_sentiment %>% quantile(1/3),
    sentiment_by_category$mean_sentiment %>% quantile(2/3)
    )

sentiment_by_category_summary <-
  tibble(name = names(tertiles),
         value = tertiles)

sentiment_by_category_summary %>%
  add_kable()


tertiles <- c(
    sentiment_by_category$mean_sentiment %>% quantile(1/3),
    sentiment_by_category$mean_sentiment %>% quantile(2/3)
    )

sentiment_by_category_summary <-
  tibble(name = names(tertiles),
         value = tertiles)

sentiment_by_category_summary %>%
  add_kable()
| Name | Value |
|---|---|
| 33.33333% | 0.25 |
| 66.66667% | 0.78 |
We'll use these tertiles as the bounds for assigning valences:
bad_sentiment_upper_bound <-
  sentiment_by_category_summary %>%
  filter(name == sentiment_by_category_summary$name[1]) %>% pull(value)
good_sentiment_lower_bound <-
  sentiment_by_category_summary %>%
  filter(name == sentiment_by_category_summary$name[2]) %>% pull(value)

sentiment_by_category <-
  sentiment_by_category %>%
  mutate(
    sentiment_valence = case_when(<a data-mce-x="2" data-mce-y="8" href="https://monkeylearn.com/blog/wp-admin/post.php?post=3286&action=edit#" id="mcegrid82" class="mce-active"></a>
      mean_sentiment < bad_sentiment_upper_bound ~ "Bad",
      mean_sentiment >= bad_sentiment_upper_bound &<a data-mce-x="2" data-mce-y="8" href="https://monkeylearn.com/blog/wp-admin/post.php?post=3286&action=edit#" id="mcegrid82" class="mce-active"></a>
        mean_sentiment <= good_sentiment_lower_bound ~ "Meh",
      mean_sentiment > good_sentiment_lower_bound ~ "Good"
    ) %>% factor()
  )

sentiment_by_category %>%
  add_kable(add_scrollbox = TRUE)
| Category | Mean Sentiment | Sentiment Valence |
|---|---|---|
| General | 0.98 | Good |
| Purpose | 0.92 | Good |
| Emojis | 0.88 | Good |
| Groups | 0.88 | Good |
| Integrations | 0.85 | Good |
| Feedback-Recommendation | 0.85 | Good |
| Attachments-Sharing | 0.82 | Good |
| UI-UX | 0.76 | Meh |
| Channels | 0.75 | Meh |
| Mobile | 0.73 | Meh |
| Ease of Use | 0.71 | Meh |
| Customer Support | 0.67 | Meh |
| Web | 0.56 | Meh |
| Desktop | 0.28 | Meh |
| Messages | 0.19 | Bad |
| Calls | 0.11 | Bad |
| Other | 0.11 | Bad |
| Search | -0.32 | Bad |
| Notifications | -0.49 | Bad |
| Pricing | -0.56 | Bad |
| Performance-Quality-Reliability | -0.83 | Bad |
sentiment_valence_order <- c("Good", "Meh", "Bad")

sentiment_by_category$sentiment_valence <-
  sentiment_by_category$sentiment_valence %>% fct_relevel(sentiment_valence_order)
NB that "Meh" does not mean "Neutral". These tag valences are only meaningful relative to one another because tags tend to be rated positively on the whole (0.42) on average. That means that even the lower bound of "Meh", 0.25 exceeds Neutral, which we've coded as 0.
Now we can color the bars of our plot with those valences. This will be useful when we shake up the order of the aspects as we arrange them by different variables while retaining the measure of sentiment per category:


Sentiment by Aspect
As you can see from the plot above, the Performance-Quality-Reliability tag gets the lowest average sentiment, whereas General gets the highest.
This plot is useful, but it doesn't tell us anything about how often people complain about the aspects of the product that tend to get low sentiment ratings. Are the low-sentiment aspects mentioned very frequently or are their mentions few and far between, and maybe limited to a certain segment of the user base? This is potentially an important question when thinking about prioritizing bug fixes and feature improvements.
To that end, let's plot the frequency with which opinion units are categorized into different aspects:
category_freq <-
  dat_clean %>%
  group_by(category) %>%
  count(sort = TRUE) %>%
  rename(
    n_opinion_units = n
  ) %>%
  left_join(sentiment_by_category)


Aspect Mentions
From the plot, I can't pick out a clear relationship between sentiment and number of opinion units classified into an aspect. That suggests that people aren't systematically bemoaning the low-sentiment categories more than they are praising the high-sentiment categories or vice versa.
Now we can weight the aspect-sentiment by the number of times it occurs in an opinion unit. This can give us a better idea of the sentiment in the context of how often it's mentioned. This is important because if an aspect has very low sentiment but it's almost never mentioned, it may be less critical to focus on improving than an only mildly badly rated category with a lot of mentions:
sentiment_by_category_weighted <-
  category_freq %>%
  mutate(
    weighted_sentiment = mean_sentiment * n_opinion_units
  ) %>%
  arrange(desc(weighted_sentiment))

sentiment_by_category_weighted %>%
  add_kable(add_scrollbox = TRUE)
| Ease of Use | 1607 | 0.71 | Meh | 1141 |
| General | 1158 | 0.98 | Good | 1133 |
| Integrations | 562 | 0.85 | Good | 477 |
| Purpose | 491 | 0.92 | Good | 454 |
| Channels | 598 | 0.75 | Meh | 446 |
| Groups | 323 | 0.88 | Good | 283 |
| Attachments-Sharing | 339 | 0.82 | Good | 277 |
| UI-UX | 196 | 0.76 | Meh | 148 |
| Mobile | 175 | 0.73 | Meh | 128 |
| Feedback-Recommendation | 132 | 0.85 | Good | 112 |
| Emojis | 97 | 0.88 | Good | 85 |
| Messages | 422 | 0.19 | Bad | 80 |
| Desktop | 195 | 0.28 | Meh | 55 |
| Other | 173 | 0.11 | Bad | 19 |
| Web | 32 | 0.56 | Meh | 18 |
| Customer Support | 24 | 0.67 | Meh | 16 |
| Calls | 71 | 0.11 | Bad | 8 |
| Search | 77 | -0.32 | Bad | -25 |
| Notifications | 203 | -0.49 | Bad | -99 |
| Pricing | 198 | -0.56 | Bad | -110 |
| Performance-Quality-Reliability | 366 | -0.83 | Bad | -302 |


Aspect sentiment weighted by the number of mentions
Even when weighing sentiment by frequency, it seems that Slack is generally doing well overall. Medium or high sentiment categories dominate the reviews in general. On the downside, people complain a lot about Search, Notifications, Pricing and Performance-Quality-Reliability.
Subratings analysis
What about all those other ratings of different aspects of the platform? It might be useful to compare them to aspects assigned by MonkeyLearn. Recall that subratings on Capterra are these things:


Subratings on Capterra
So they're different beasts than the aspects we have defined on our model, which are assigned at the opinion unit level; sub-ratings represent a broad judgment of an entire angle of the product.
First, we have to unnest our subratings which until now we've quietly shunted along in the list column we created from the blob of text we got them in, e.g.:
all_reviews_slack$sub_ratings %>% sample(2)


## [1] "5       /       5                                                        Ease of Use                                                                                                                                                 3       /       5                                                        Customer Support                                                                                                   3       /       5                                                    Value for Money"
## [2] "5       /       5                                                        Ease of Use                                                                                                                             5       /       5                                                        Features & Functionality                                                                                                                                                 5       /       5                                                        Customer Support                                                                                                   5       /       5                                                    Value for Money"
We transformed that into a nested list column:
dat$sub_ratings_split %>% sample(2)


## [[1]]
## # A tibble: 4 x 2
##   subrating_title          subrating_rating
##   <chr>                    <chr>
## 1 Ease of Use              5/5
## 2 Features & Functionality 5/5
## 3 Customer Support         5/5
## 4 Value for Money          4/5
##
## [[2]]
## # A tibble: 2 x 2
##   subrating_title          subrating_rating
##   <chr>                    <chr>
## 1 Ease of Use              5/5
## 2 Features & Functionality 4/5
We'll now want to parse these "4/5", "5/5", etc. strings of subrating_ratings into numbers we can work with, in the same way we did the overall ratings:
parsed_subratings <-
  reviews_with_subratings_unnested %>%
  rowwise() %>%
  mutate(
    subrating_num =
      ifelse(is.na(sub_rating_rating), NA,
        parse(text = sub_rating_rating) %>% eval()
      )
  )

parsed_subratings %>%
  select(sub_rating_category, sub_rating_rating, subrating_num) %>%
  sample_n(5)


## # A tibble: 5 x 3
##   sub_rating_category      sub_rating_rating subrating_num
##   <chr>                    <chr>                     <dbl>
## 1 Features & Functionality 5/5                       1.00
## 2 Value for Money          4/5                       0.800
## 3 Value for Money          4/5                       0.800
## 4 Features & Functionality 4/5                       0.800
## 5 Ease of Use              5/5                       1.00
Now for some averages. What are the overall mean ratings of each aspect of the platform?
parsed_subratings_summary <-
  parsed_subratings %>%
  drop_na(subrating_num, sub_rating_category) %>%
  group_by(sub_rating_category) %>%
  summarise(
    mean_subrating = mean(subrating_num)
  )

parsed_subratings_summary %>%
  add_kable()
| Customer Support | 0.89 |
| Ease of Use | 0.93 |
| Features & Functionality | 0.91 |
| Value for Money | 0.91 |
How do these subratings match up with category ratings we calculated earlier? Some of the subrating names match perfectly with MonkeyLearn aspects like "Customer Support" and "Ease of Use", but the other two we'll need to assign an alias to be able to join it up with the mean MonkeyLearn sentiment for that category and compare the two:
parsed_subratings_summary$alias <- c("Customer Support", "Ease of Use", "General", "Pricing")

parsed_subratings_summary %>%
  left_join(sentiment_by_category,
    by = c("alias" = "category")
  ) %>%
  add_kable()
| Customer Support | 0.89 | Customer Support | 0.67 | Meh |
| Ease of Use | 0.93 | Ease of Use | 0.71 | Meh |
| Features & Functionality | 0.91 | General | 0.98 | Good |
| Value for Money | 0.91 | Pricing | -0.56 | Bad |
What's interesting here is that people on average rate each of the four subrating aspects very high. However, when they mention them in reviews the sentiment they attach to them can be much lower.
If we take Pricing / Value for Money, for example (which may not actually be analogous concepts but let's roll with it for a minute), the sentiment attached to explicit mentions of the price of the service tend to be negative, though its Value for Money is rated well. I can see two explanations for this. The uninteresting interpretation is that most people use the free version of Slack and so they're getting something for nothing, which is a pretty good value for your money. A slightly more interesting interpretation would be that the "silent majority" on the aspect of pricing actually thinks they're getting a pretty good deal but a vocal minority disagree and that minority are the only ones voicing their dissatisfaction with the pricing model.
In any case, you could see this as evidence that it's important to take both the explicit numbers as well as sentiments into account when considering a certain aspect of a product, and as always, the base rates of users' contributions to both.
Searching for keywords to get more insights
Keyword analysis can provide nice insights as well if you associate it with sentiment. Say, for example, that you would like to know what it is that people are talking about when they express negative opinions about the Performance-Quality-Reliability aspect. You can use MonkeyLearn’s Keyword Extractor in order to get the most relevant words or expressions in that data. Look at the examples below:
| Keyword | Relevance |
|---|---|
| Slack | 0.682 |
| paid version | 0.333 |
| bit | 0.32 |
| time | 0.295 |
| little bit | 0.238 |
| app | 0.224 |
| messages | 0.201 |
| notifications | 0.185 |
| mobile version | 0.174 |
| issues | 0.171 |
| internet connection | 0.127 |
| desktop version | 0.127 |
| mobile app | 0.127 |
| problem | 0.107 |
| load | 0.10 |
| conversations | 0.09 |
| learning curve | 0.09 |
Now we know more about the different sub-aspects that might deserve some extra attention (for example, loading times) and, more importantly, some extra action!
Summary of negative opinions on Performance-Quality-Reliability
MonkeyLearn’s Summary Extractor can help us get the gist of what our text data says by summarizing all the data we submit. The 350-word summary below was created from all of the Slack reviews with a negative sentiment that mentioned Slack’s performance, quality, or reliability.
The free version of Slack offers quite a bit of functionality and has worked for all of my current needs. The fact that chat history is limited in the free version is something I do not like very much as I have lost some important data and also the app on the laptop can be slow at times. The free version only stores your most recent 10,000 messages and files, which can be a problem if you need to keep track of those conversations.. To use Slack you need a good Internet connection, it is a bit heavy and the free version has its limitations of space. Also, depending on whether or not you install the app or just use the browser to open it, you might see some issues loading Slack and/or uploading heavy files there. I think that the storage in the free version is a little bit limited. The desktop application is a bit slow and it takes time to open it. We use the free version of Slack in our office, only because a user cost is a little bit steep.. but the notifications on mobile app are not real-time which creates a little delay in receiving the messages when you are not in front of the system. Also sometimes the application gets hanged......rarely. Sometimes it takes too long to load, has limits on the amount of data that you can use on the free version of the software. Fortunately there's a free version (with message history and app limit) so it's not such a big problem after all. I think the pricing is a bit high since it's per user per month, so we currently use the free version which still works well. What I do not like is that sometimes the desktop client gets a little slow and does not load the conversations, the slack chrome plugin works better for me. The only thing negative I can say about slack is that from time to time, the mobile app is a little slow and laggy.
Probably, you wouldn’t have had time to read all of the reviews, but a 350-word summary is much more reader-friendly and it will give you much more information about your data than reading a couple of samples only.
Wrap-Up
Here we've built a relatively straightforward pipeline for sentiment analysis in R of customer reviews data. We grab and clean our raw reviews, feed it to MonkeyLearn for extraction and classification, and then analyze the results to get some unique insights.
MonkeyLearn allows us to abstract out the machine learning and plug into a simple and reliable API. What's also nice about this approach is, if we're Slack and interested in the ways in which a competitor's ratings and reviews differ from ours, we can reuse everything we've done here and simply use a different URL to compare other product reviews to ours.
Human-generated text data is inherently fuzzy and interesting to probe through. Piles of it, though, can be daunting to extract any actionable insights out of. MonkeyLearn provides a way to identify variables that are both nameable and account for a lot of the variance in our data --a sort of interpretable PCA for text data. That means less time on the modeling treadmill and more time analyzing and getting insights.
Thanks for reading and happy coding!
- Shoutout to some co-detective work with Josh Stevens-Stein↩


Amanda Dobbyn
July 24th, 2018
Posts you might like...


Text Analysis with Machine Learning
Turn tweets, emails, documents, webpages and more into actionable data. Automate business processes and save hours of manual data processing.
Try MonkeyLearn


