How to Do Sentiment Analysis & Visualize Results in Power BI

Sentiment analysis is an AI technique that automatically analyzes unstructured text data for opinion and emotion: positive, negative, neutral, and beyond.
Take the below sentence, for example:

Properly trained machine learning software can read through thousands of documents, social media posts, product reviews, customer surveys, etc., in just minutes to classify by positivity or negativity and mine for opinion.
When used in tandem with business intelligence programs like Microsoft Power BI, you can visualize these results in striking charts and graphs for easy-to-understand insights. We’ll show you how to get the most out of Power BI with a tutorial below, but first, we’ll show you how to perform sentiment analysis in a few quick steps with MonkeyLearn.
How to Do/Perform Sentiment Analysis
MonkeyLearn is a powerful SaaS text analysis platform with pre-trained models to perform sentiment analysis, topic classification, keyword extraction, feedback classification, and more. Or you can train custom models to your specific needs for even more in-depth analysis.
The pre-trained sentiment analysis demo is exceedingly easy to use. Just enter text or copy and paste, then click ‘Classify Text.’
However, to get results built specifically to the language of your text and your business, we recommend building your own tools with MonkeyLearn. We’ll show you how easy it is to do in five easy steps:
1. Create a new model
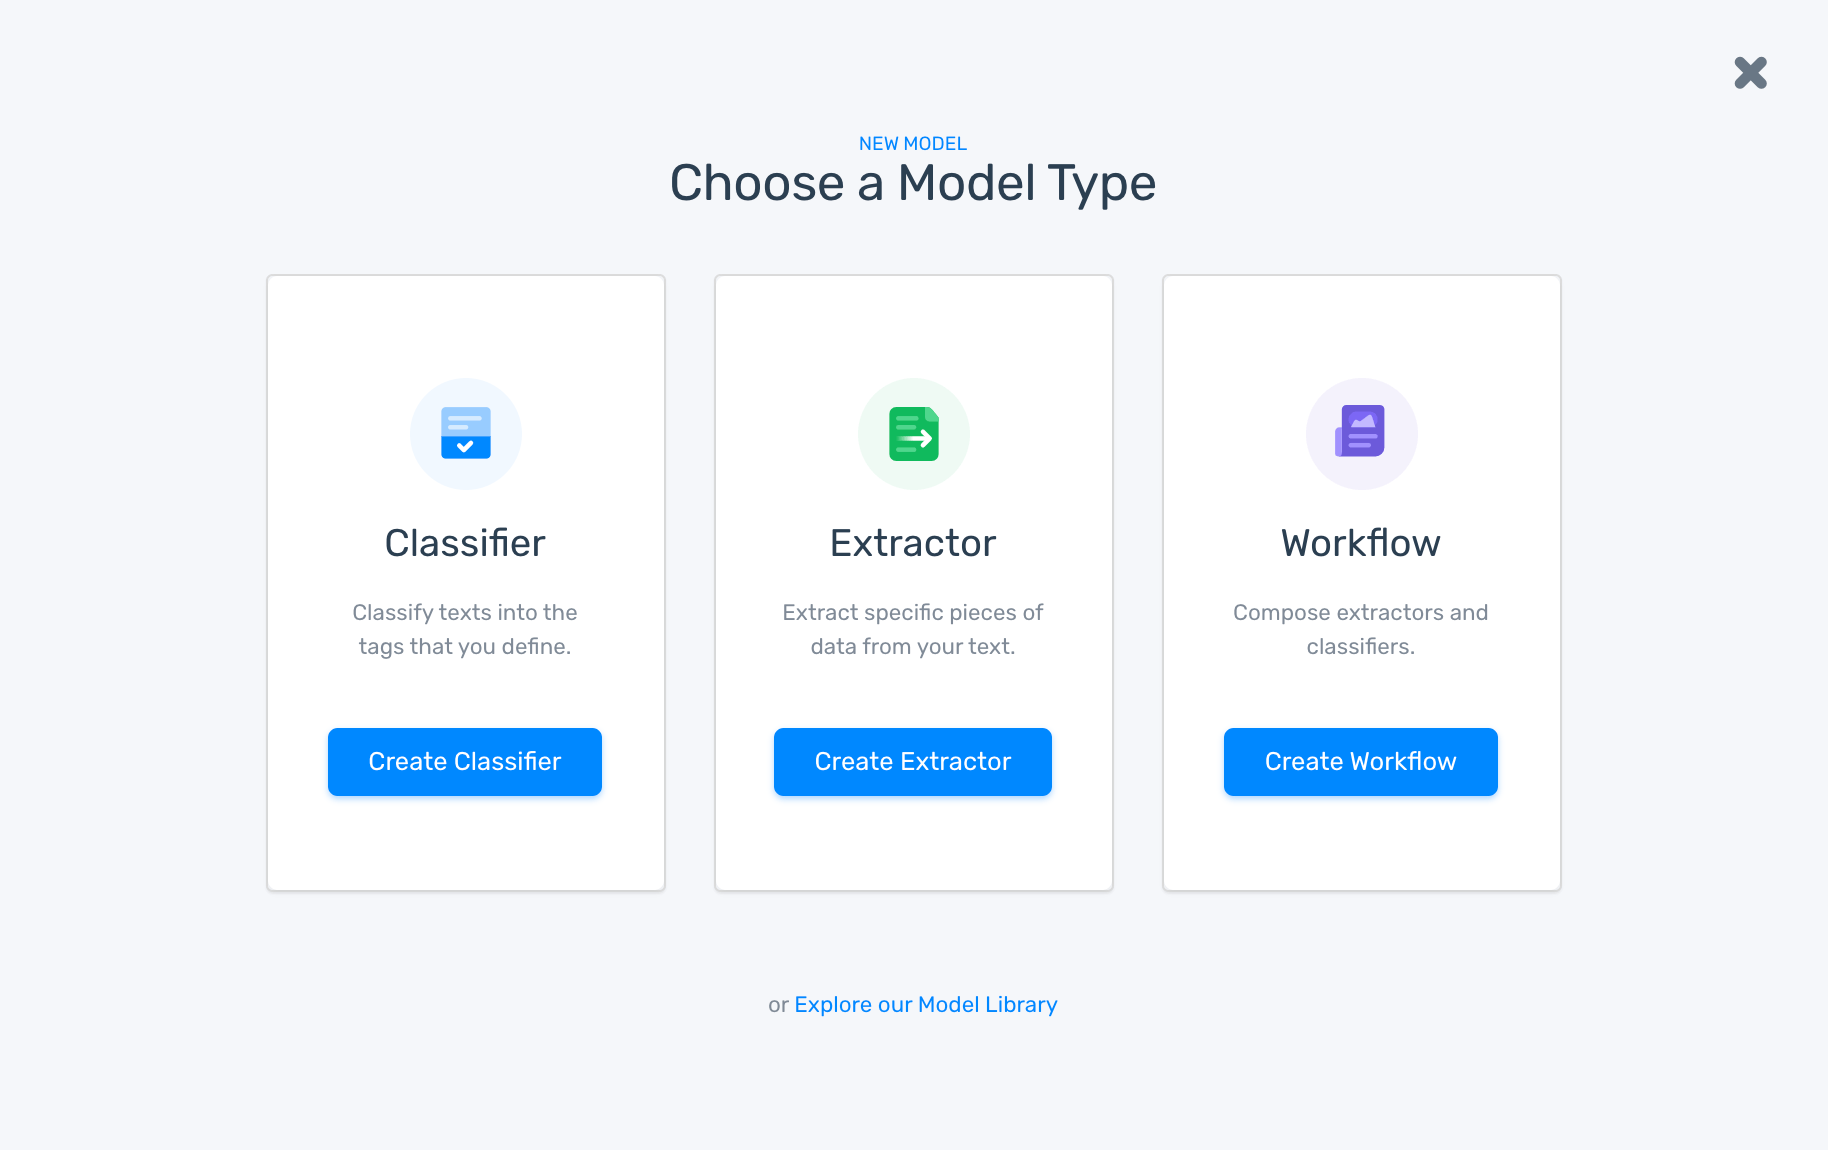
In MonkeyLearn’s dashboard, click on ‘Create Model,’ in the upper right, then choose “Classifier”. Sentiment analysis is a classification task.
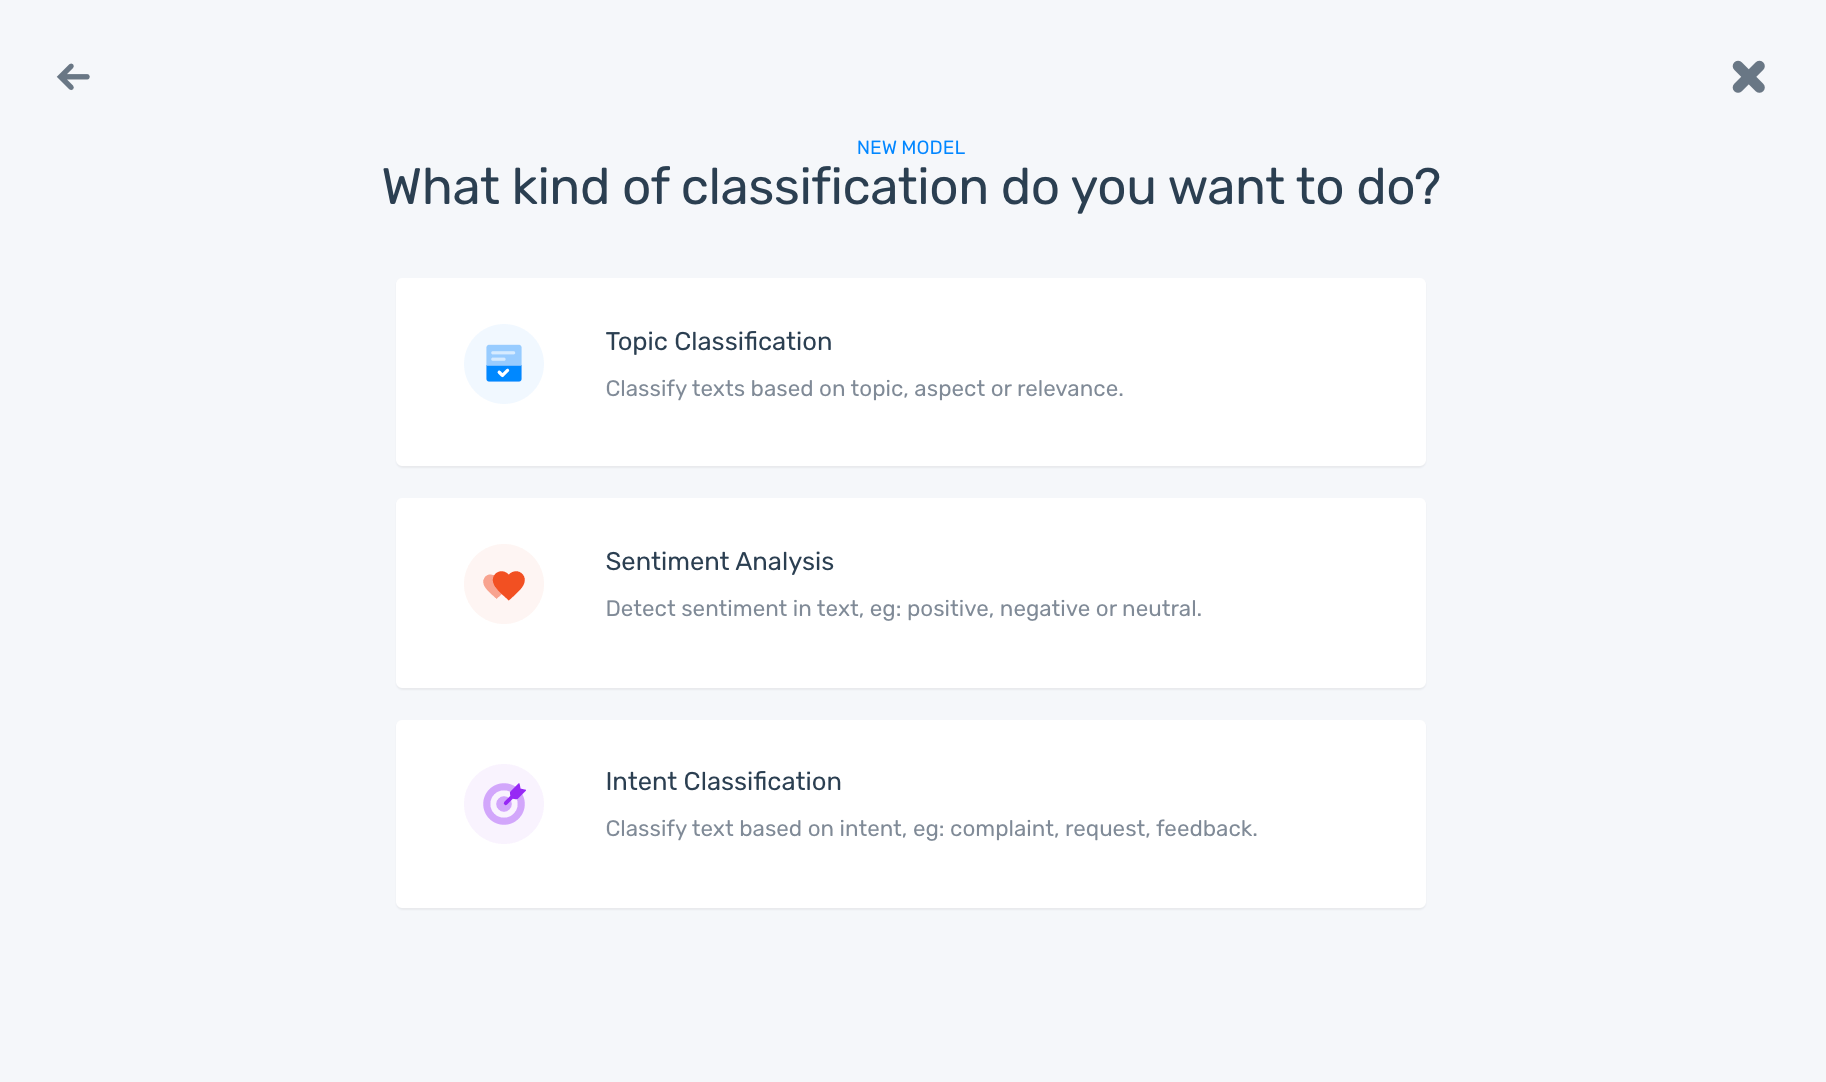
2. Choose ‘Sentiment Analysis’
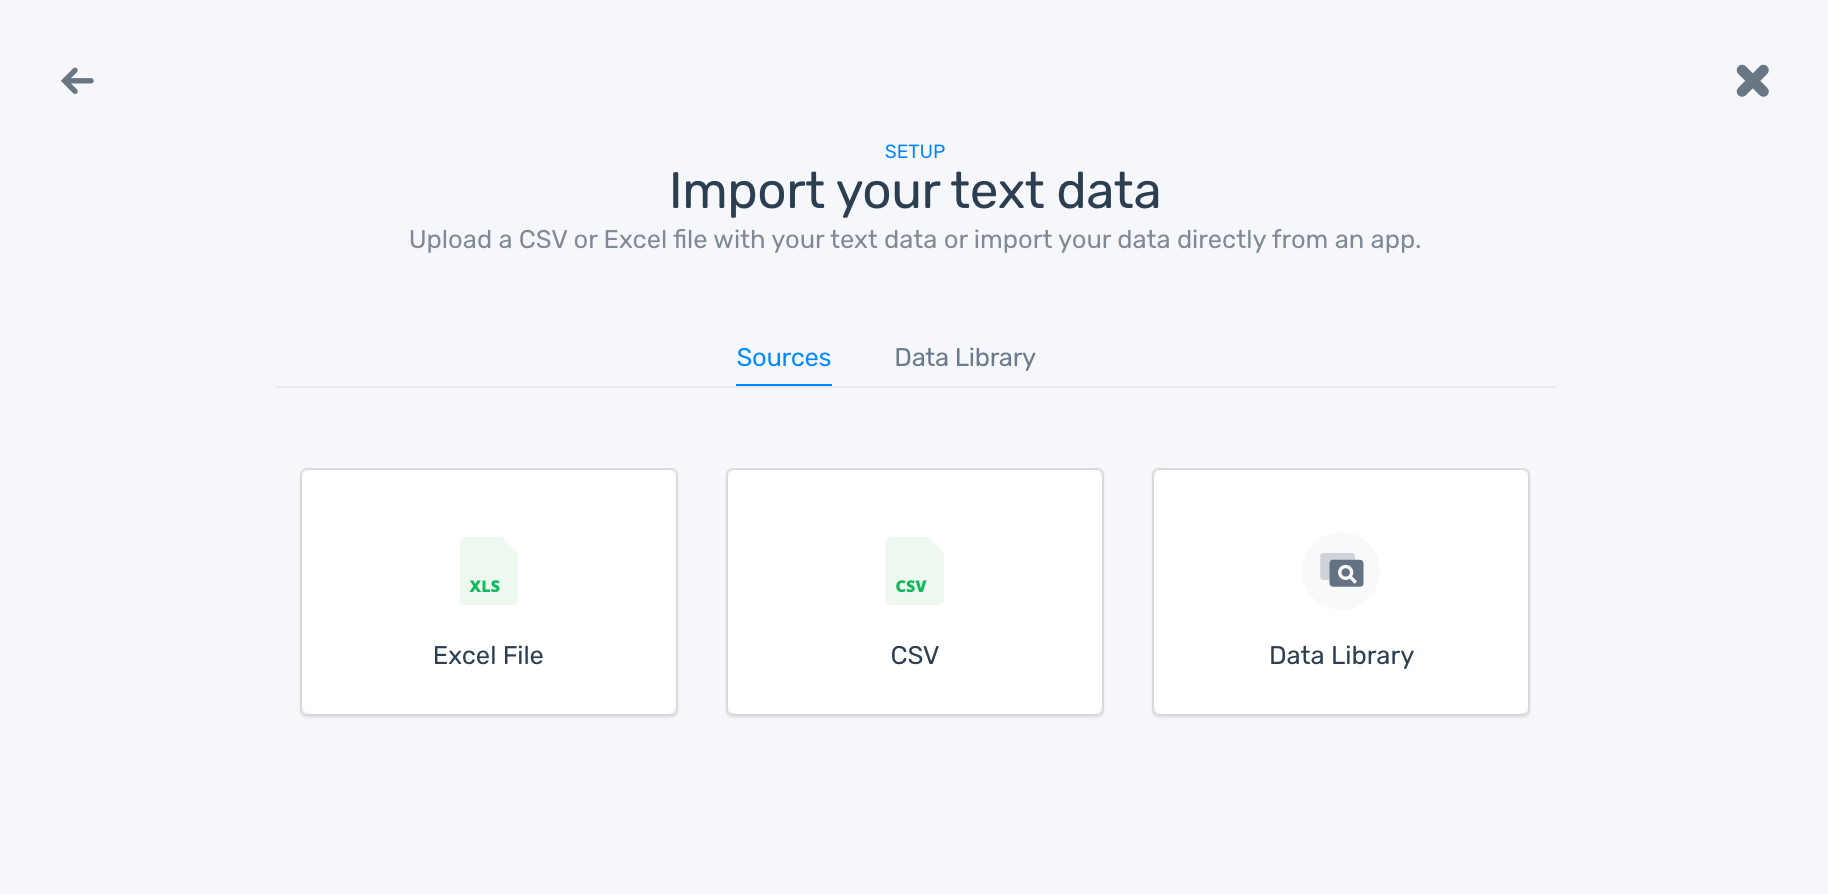
3. Import data
Upload text data, which will be used to train the sentiment classifier model. You can upload data as a CSV or Excel file.
4. Train models
Tag each piece of text Positive, Negative, or Neutral, according to your criteria.
After tagging some examples, models will start making their own predictions. If results are inaccurate or have low sentiment scores, you can re-tag them to improve the model’s performance.
5. Test the sentiment analysis model
Click on the ‘Run’ tab and paste or enter new text to test models. If a model is still delivering low accuracy, you can go back to ‘Build’ and manually tag more examples.
To process new data, you can connect to one of the many integrations or directly to your data source using MonkeyLearn’s API key.
Or you can upload a CSV or Excel file.
Over to you. Try building your own sentiment analysis tool using our intuitive, no-code interface. Just request access to MonkeyLearn’s tools for your free trial.
Visualize Your Sentiment Analysis Results With Power BI
For the previous tutorial, we batch processed our Facebook reviews, which we’ll now put through Power BI.
Microsoft’s Power BI is one of the preeminent business intelligence tools to create insightful visualizations and showcase your sentiment analysis results. It’s great for showing comprehensive data results in commanding, yet easy-to-understand format. Power BI offers a number of options to display your results to your liking.
Sign up to try Power BI for free.
1. Go to ‘My Workspace’ and click ‘Create.’

2. Click on ‘Datasets.’

3. Upload your data
You can use CSV or Excel files, other reports or workbooks, or connect to a database.

4. Choose your file source

5. Upload your data
Again, we’re using our Facebook reviews data set that was batch processed by the MonkeyLearn sentiment analyzer.

6. Power BI will automatically create a new report

7. Choose your fields and visualizations
The fields relate to the data you uploaded and the visualizations offer a number of chart and graph choices.

As you can see below, our Facebook reviews dataset also has reviews broken into topics: Advertisement, Messages & Inbox, News Feed, Notifications, Photos, Security & Privacy, and Videos.
This page shows all of the data together. You can see overall sentiment classification numbers and percentages. In the bottom right are the actual texts of each review.

Select or deselect boxes to change the filter criteria.

Choose “Filter” to refine data expressions by particular tags or other criteria. Here shows only reviews by the “News Feed” tag.

And by “Photos.”

There are a lot of cool visualizations to play around with. And integrations allow you to easily use the displays for reports and presentations.
You can embed apps like Salesforce, Dynamics, Adobe, and Google Analytics directly in Power BI, and integrate easily with Microsoft programs.
Wrap Up
Performing text analysis on all manner of text data can be extremely useful to your business. Once you have a model properly trained to your needs, you can do it regularly, 24/7, to keep an eye on customer and public sentiment.
Visualization tools, like Microsoft Power BI, can help you get the most out of your sentiment analysis results for a clear, comprehensive, and striking view into the fine details.
Search Twitter for company mentions; find out what’s being said about your company in the news; organize customer reviews by subject and analyze to find out where your business excels and where you may need to improve.
Request a demo from the sales team at MonkeyLearn. You’ll be amazed by what text analysis can do for your business.

Rachel Wolff
July 3rd, 2020


