What is a Good NPS Score? (2022 Net Promoter Score Benchmark)

A Net Promoter Score (NPS) is a standard customer satisfaction metric to measure how loyal customers are to a brand overall.
NPS scores are calculated by averaging customers’ likelihood of recommending a brand on a 1-10 scale. They can then be used to inform you where your brand stacks up against your direct competitors.
In this post, we'll shed light on what’s considered a good NPS score for your industry, and share some practical methods to improve your score using machine learning tools like MonkeyLearn.
Feel free to click through to the section most useful to you.
- How to Calculate Your NPS Score
- What is a Good NPS Score?
- NPS Benchmarks by Industry
- How to Improve your NPS Score
How To Calculate Your NPS Score
NPS scores are calculated by asking customers the following question:
“On a scale of 0 to 10, how likely are you to recommend our business to a friend or colleague?”
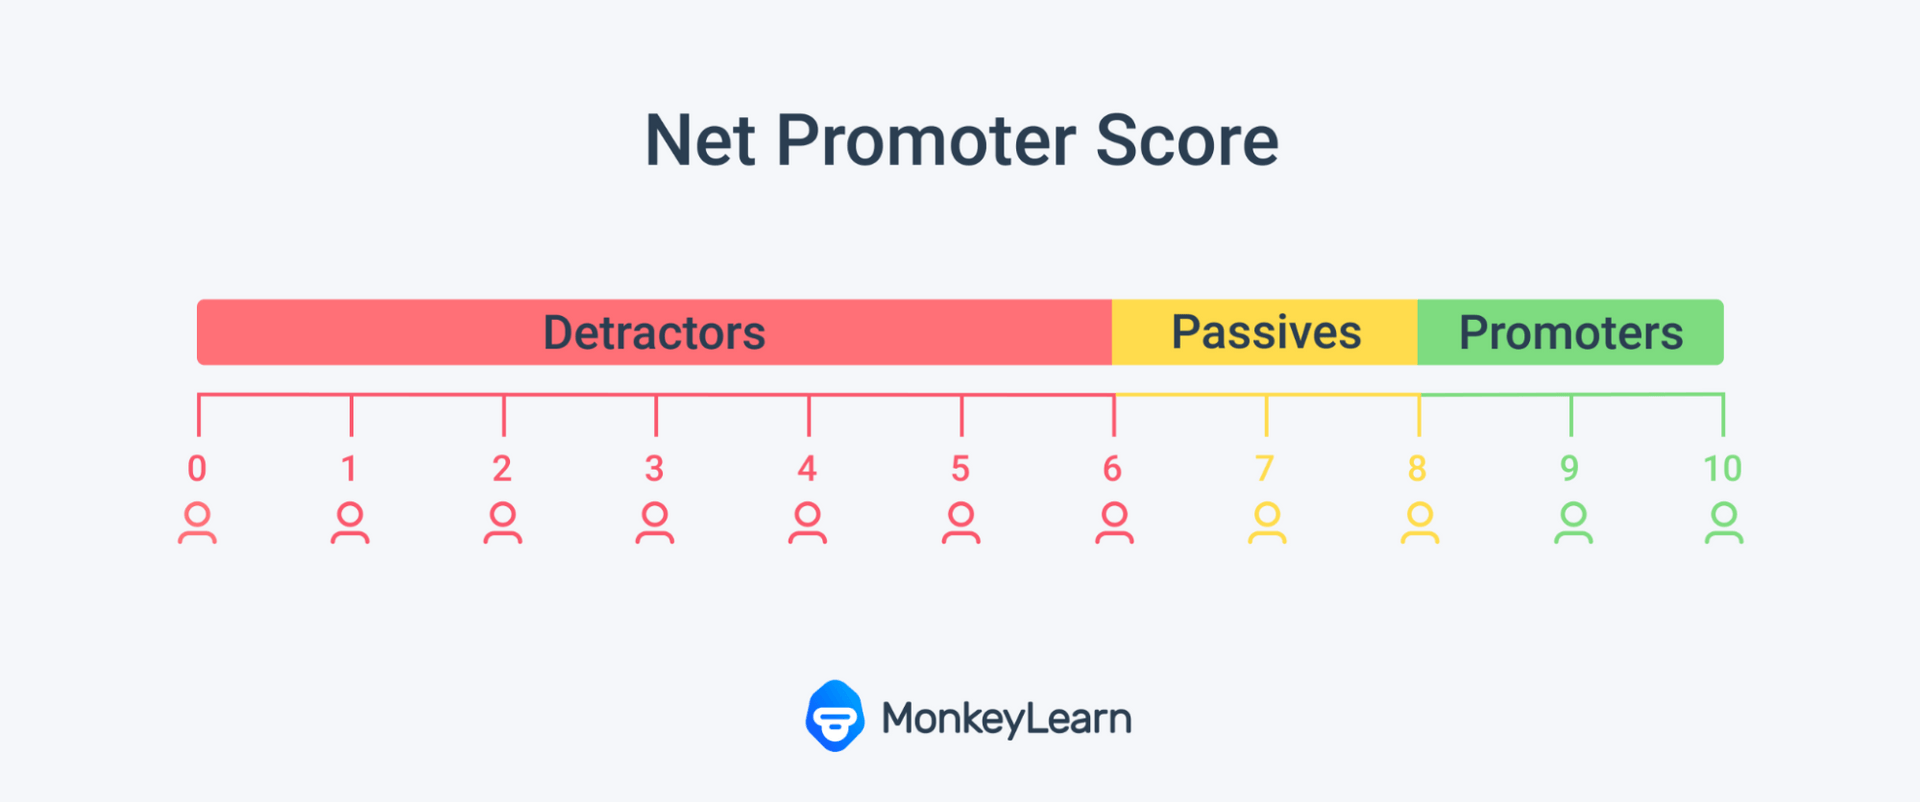
NPS takes this data (gathered on a scale of 1-not likely to 10-extremely likely) and groups customers into three categories:

Promoters (9-10)
Customers who are pleased and passionate about your product and are very likely to spread the word about you.
Passives (7-8)
Indifferent customers who are at risk of switching to another product. This is a key group whose NPS survey responses can be further analyzed to prevent customer churn.
Detractors (1-6)
Unhappy customers who might share negative feedback about your product. While unfortunate, unpacking their issues and seeking out and taking in their feedback is invaluable for finding solutions to their problems and improving your product overall.
Once you’ve sorted customer responses into these three groups, you can plug results into this handy-dandy NPS formula:

So, say 60% of your responses are Promoters and 20% are detractors, 60 - 20 = 40, so your NPS would be 40, a positive rating!
With this knowledge, you’re ready to delve into what makes up a good NPS score versus a bad one.
What Is a Good NPS Score?
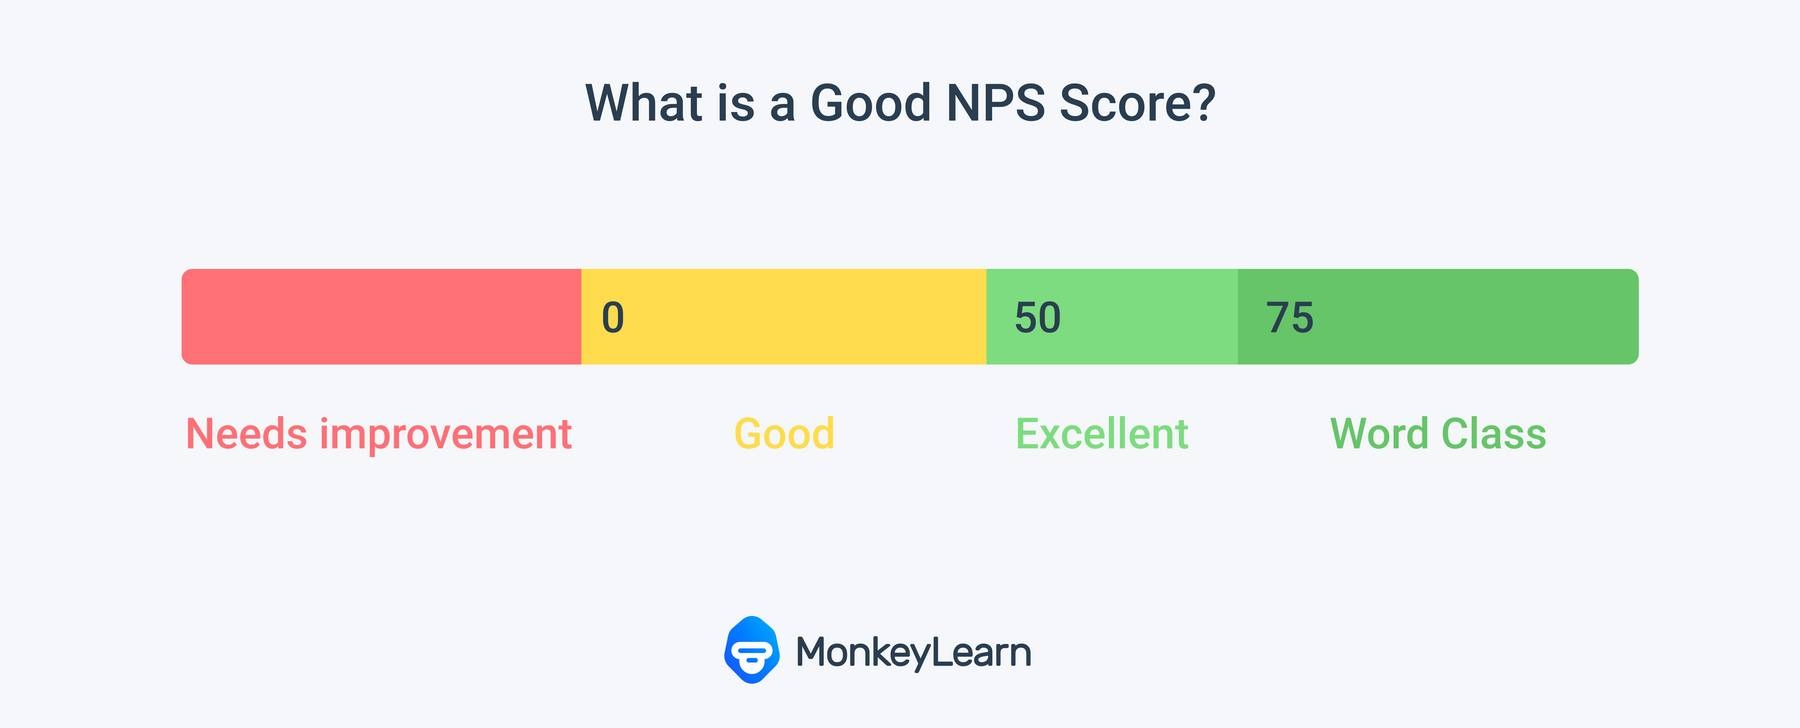
A “good” NPS score is anything above 0. Exceeding the score of 0 indicates overall customer loyalty to your brand, as you have more promoters than detractors.
Per Doter, in 2022 on average, anything above 50 can be considered “Excellent” and anything above 75 “World-class”.
Here is a graphic to help visualize this NPS spectrum:

As you can see, anything below zero indicates a need for improvement – meaning there are more detractors than promoters, whereas the closer we get to an NPS of 100, the higher level of customer loyalty (100 meaning all promoters and 0 detractors).
However, when reflecting on what your NPS score means for your brand in particular, it is important to note that an NPS is just a single metric (useful when comparing to competitor’s scores) not a holistic reflection of your total customer experience (CX).
Other metrics, such as CSAT (Customer Satisfaction Score) or CES (Customer Effort Score), exist to provide additional context for measuring customer satisfaction at each stage of the customer journey. Here you can find the different functions each customer satisfaction metric serves.
NPS Benchmarks by Industry
NPS varies greatly from industry to industry depending on the product or service provided.
Let’s dig into the below graph for greater context.

As you can see, when we take the average benchmarks of each industry, there is a huge gap between, say, Ecommerce and SaaS. It follows that customers shopping for pleasure online tend to have a more positive experience than people in great need of software solutions.
For this reason, it is important to view your NPS score in context, meaning relative to competition in your industry rather than simply as an absolute on the -100 to 100 scale.
Industry average isn’t the only outlying factor affecting your NPS score; some other factors that influence NPS scores are:
Location and Culture
Where customers live tends to skew NPS due to different and diverse cultural practices and standards worldwide. Europeans, for example, tend to rate more conservatively (clustering in the middle) whereas feedback from customers in the United States tends to be extreme (lots of 1’s and 10’s).
Timing and Expectations
Modern attitudes and expectations also play a factor. The average NPS score of customer responses has dropped in value in recent years – likely due to increased competition driving customer standards higher.
For example, during Covid online sales have skyrocketed increasing competition and, as a result, so has the demand for a great customer experience.
Survey Channel
The time and manner by which the survey is delivered can also affect your NPS score. When the survey is provided and at what time in the process can play a part in the customers’ NPS responses or lack thereof.
If the survey is presented too soon, the customer may be annoyed, if it is too late, they may have moved on to another task and/or have forgotten their view on the experience.
Customer Complaint Tolerance Level
Your customer complaint tolerance level indicates how much your customers’ lives and/or businesses depend on your product.
This can also be calculated by simply asking your customers, “On a scale of 1-10, 1 being not likely and 10 being very likely, how likely are you to become angry if our service can’t address your needs”.
If your average is closer to 10, your business is in a low-tolerance industry, meaning customers have low tolerance if your service doesn’t meet their needs, if you are closer to 1, you are in a high-tolerance industry, meaning the opposite.
Despite existing in low-tolerance industries, brands such as Uber, Southwest and Netflix have achieved higher tolerance levels by emphasizing greater transparency, improving accessibility, and listening to their customers’ voices at a greater number of touchpoints.
How to Improve your NPS Score
Having weighed all of those factors, you might wonder what the next step is – improvement of customer satisfaction is always the goal but exactly how and what should you change about your service?
Luckily, your NPS survey doesn’t exist in a vacuum – it can also gather qualitative, actionable responses by the simple addition of an open-ended question. Usually, something along the lines of:
“What is the primary reason for your score?”
With this open-ended response you can learn what drove your customers to leave their previous scores in the first place. Unlocking and acting on your customer’s qualitative feedback following the survey is the surest way to raise your NPS score.
Of course, this qualitative data, which comes in the form of text responses, might seem daunting to sort through. So how exactly do you know what to improve from your written customer responses?
Rather than parsing the data by hand, you can use automated text analysis platforms, like MonkeyLearn to analyze your responses by topic, sentiment, keyword and more, in real-time.
After analyzing your survey data, you’ll have a more accurate idea of what is and isn’t working for your customers.
Now you can make informed adjustments and likely raise that pesky NPS score!
Conclusion
Once you’ve defined what a good NPS score is for your industry and what a given score means by delving into open-ended responses, you’ll be able to effectively improve upon your products and services.
Furthermore, by understanding the impact of environmental and survey delivery-related factors you can seek to improve your process for collecting NPS feedback.
Looking for tools to help improve your NPS score? Sign up to try out MonkeyLearn’s suite of tools for free.

Inés Roldós
May 6th, 2021


