Analyzing customer support interactions on Twitter with Machine Learning

We are seeing new trends in customer support. Some companies are starting to have a different social media appearance, trying to appear more hip and cool (probably actual words used by executives). Instead of making their social media managers behave in a professional servile-like fashion, these companies opt instead to communicate in a more personal way.
Some signs of this approach are every member of the social media team signing with their name, and engaging in conversations with users that don’t involve the company at all (but usually involving memes). These conversations can even involve friendly banter, which was absolutely unthinkable in the old days. This way of doing customer support gained a lot of attention with the viralization of Wendy’s Twitter account earlier this year.
Other companies are apparently following suit, spicing up their social media channels with personality. The question we aim to explore here is, does this actually work? We compare Twitter sentiment of different telcos to find out. Some carriers approach Twitter in a traditional way, while others try to be more loose.
Which one elicits the most positive tweets? The most negative tweets? Which one is more liked? What are these users saying? Let's find out!
Sentiment analysis on Twitter
In order to perform sentiment analysis with machine learning, we used MonkeyLearn’s public Twitter sentiment analysis model, which will classify tweets with positive, neutral _or negative_ labels. We downloaded tweets mentioning one of the four big carriers (Verizon, T-Mobile, AT&T, Sprint) using tweepy, and classified them with the MonkeyLearn python client. What this gives us is a lot of tweets, each one mentioning one telco and with a sentiment label.
Findings
Now, let’s see what we can learn from this.
On a given week, the average number of tweets mentioning a company (either by name or by handle) has AT&T on top, with an average of 64,000 tweets a week.
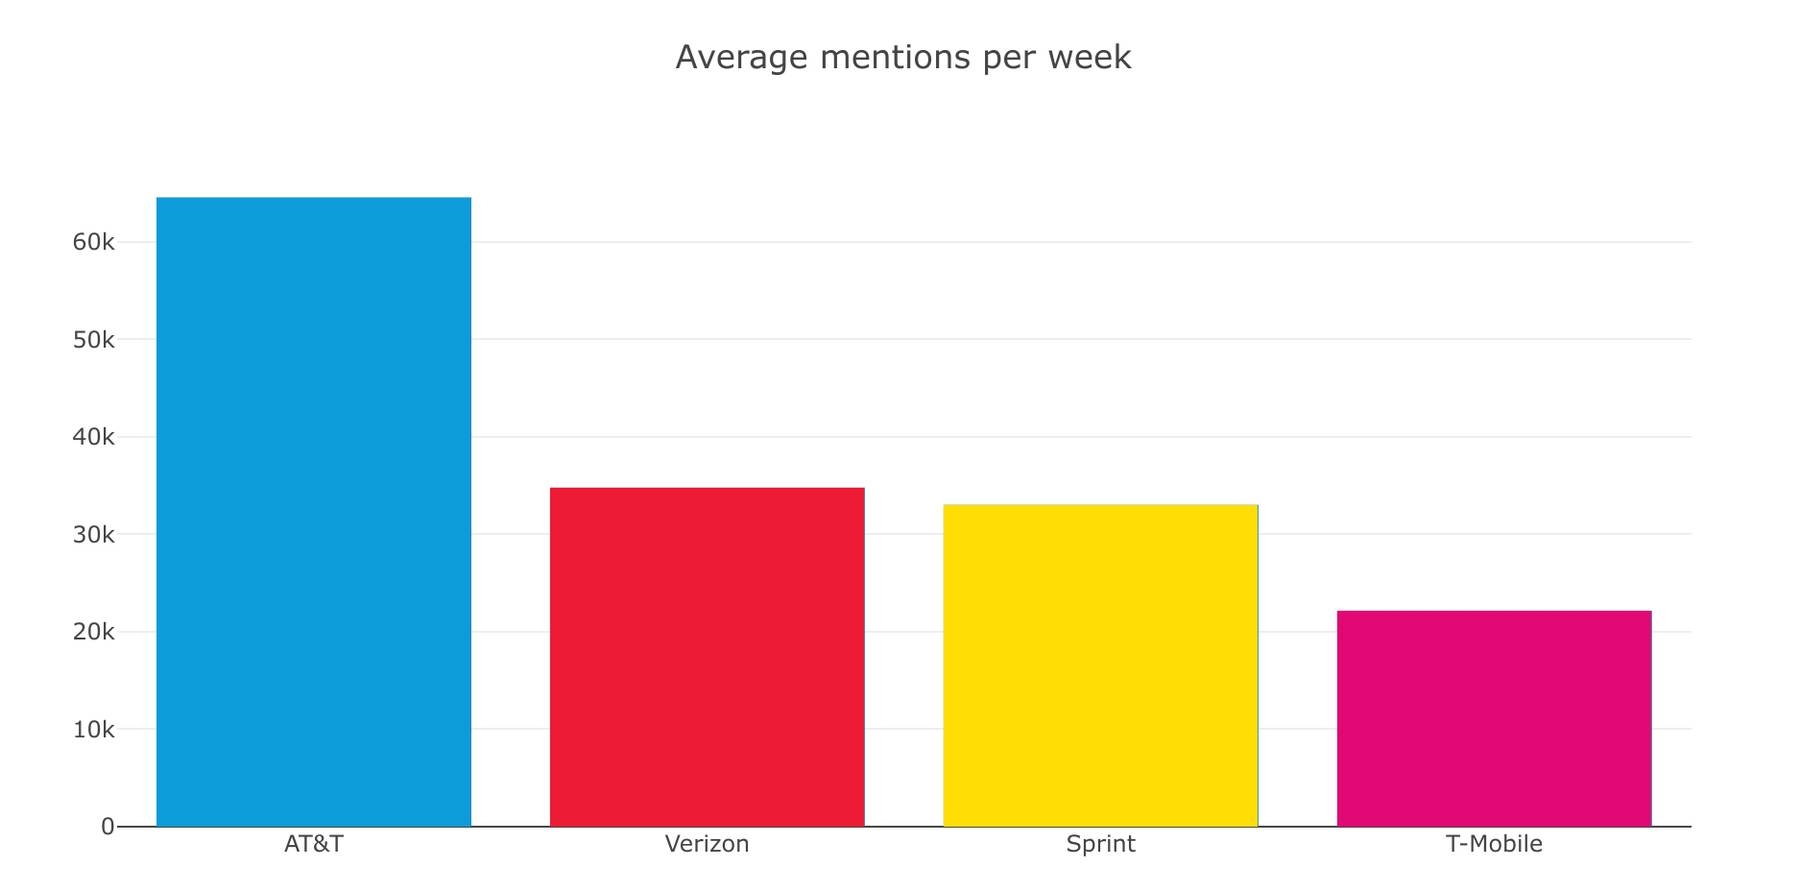
How many tweets mentioning a telco in a given week.
This was pretty surprising on its own, especially considering that Verizon and AT&T have almost the same number of subscribers. Also, Verizon has a lot more followers than AT&T, yet they have half the number of tweets on any week. This by itself is interesting, since one would expect carriers with a similar number of subscribers (or Twitter followers) to have the same number of mentions.
Sentiment analysis
Now, raw numbers are cool, but we want to know the sentiment of the users that posted these tweets and that interacted with the telcos customer support on Twitter. Are they happy customers, or angry detractors? Are they glad or indifferent towards their carrier? Are they complaining about a particular issue? To find out, we calculated the percentage of tweets of each sentiment — positive, neutral or negative — in the total of tweets for each company.
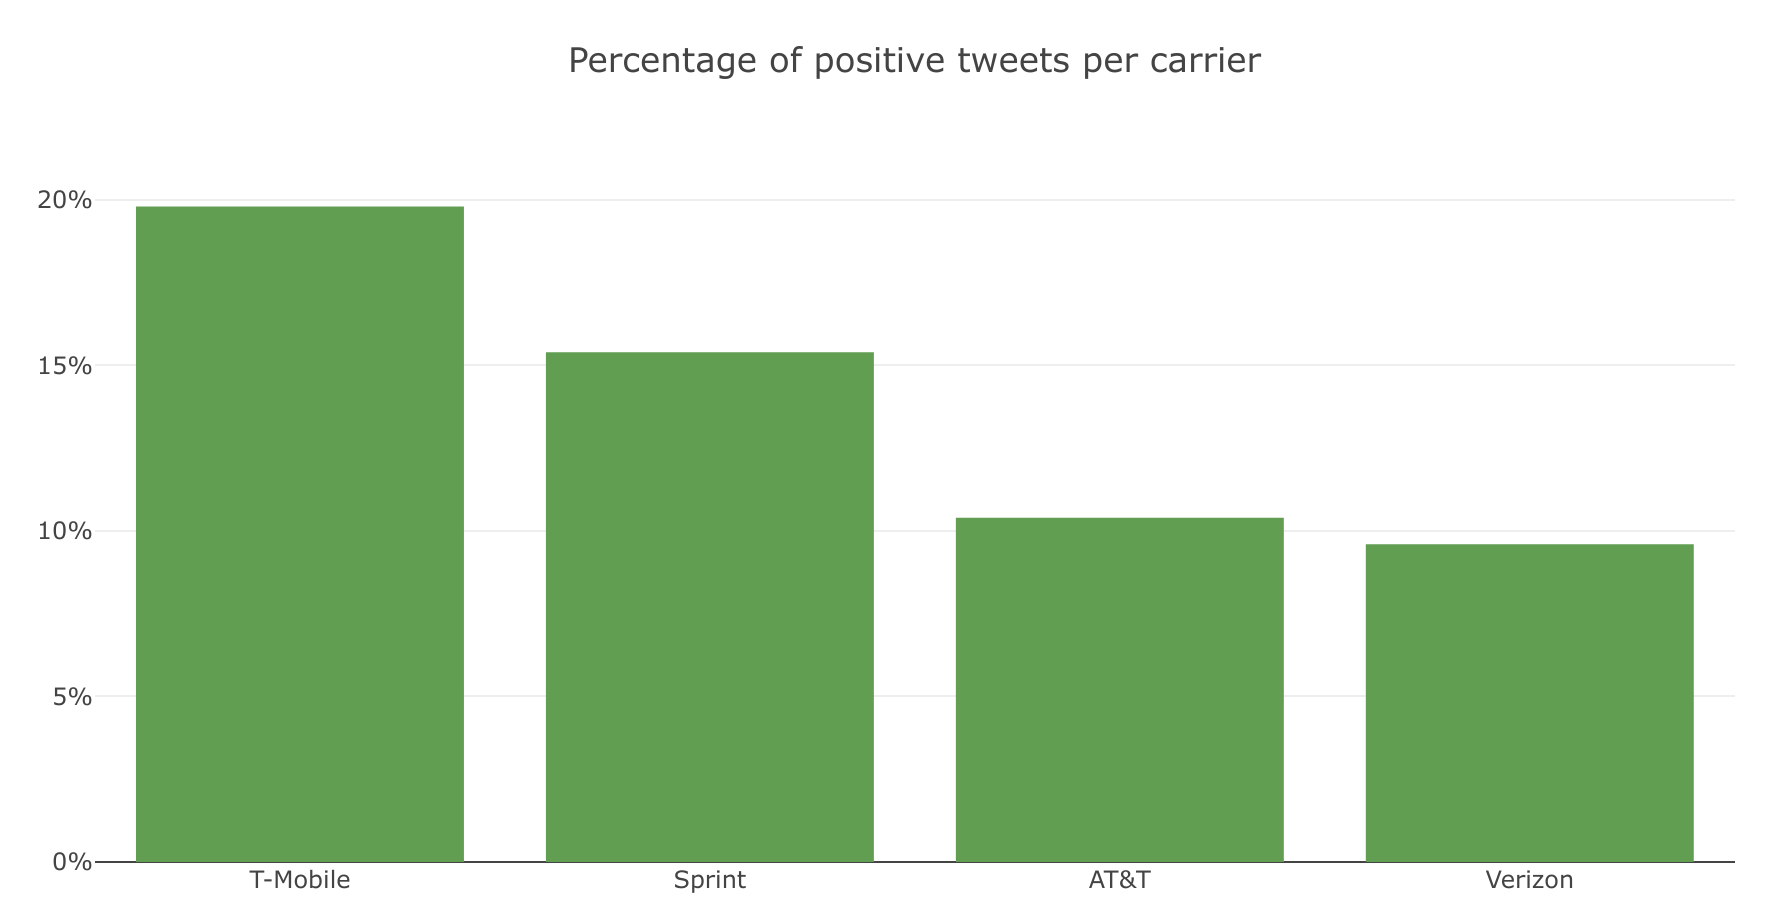
Percentage of the tweets mentioning a telco that are positive.
On the positive side, clearly on top comes out T-Mobile, with 20% of the tweets mentioning them being positive. They are ahead by their next competitor, Sprint, by a 5 percent points and have double the rating than the larger companies, AT&T and Verizon. Interestingly, the larger companies have less positive tweets than the smaller ones.
Now on the neutral side, turns out most tweets are actually neutral tweets: these are mostly factual questions, answers, or opinions that don’t express a sentiment. Here, the largest carriers have the bigger chunk of their tweets with neutral sentiment. So far what we are seeing is that a larger percentage of people are simply talking about them, without expressing a sentiment. This means either customer support, or news mentioning them.
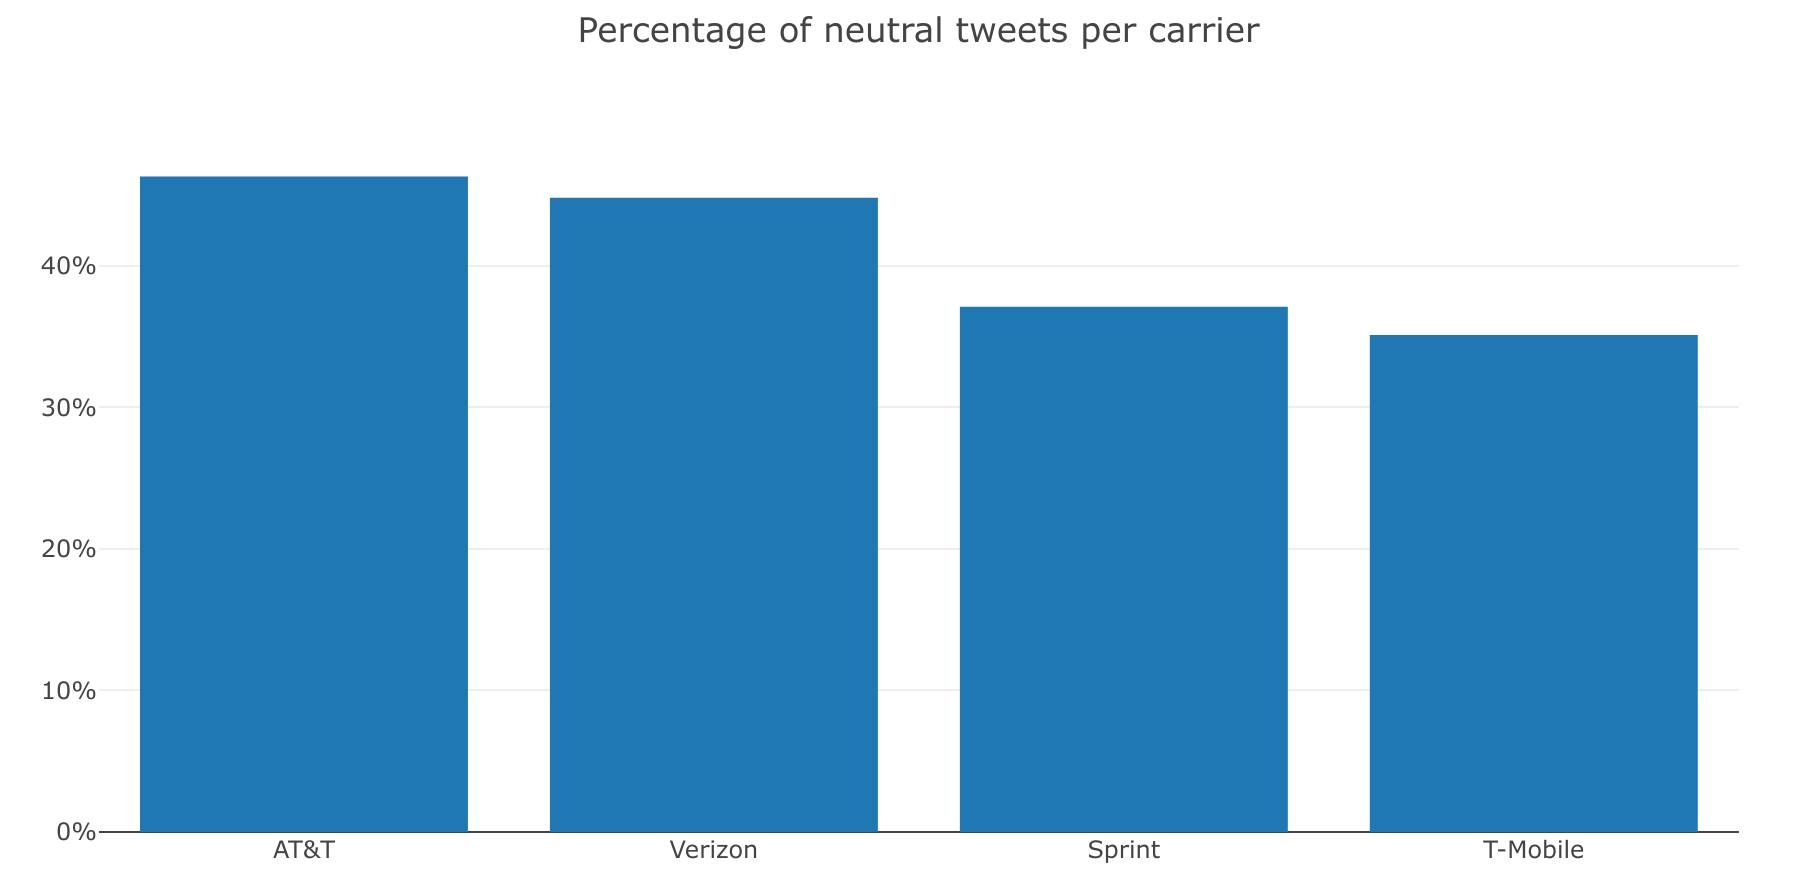
Percentage of the tweets mentioning a telco that are neutral.
Now when it comes to negative tweets, we were surprised: in proportion most companies receive less negative tweets than positive ones. This was honestly pretty unexpected, considering Twitter’s constant flamewars. The only exception is Verizon: they are the only ones that have more negative tweets than positive ones. This would mean that as far as Twitter sentiment goes, Verizon is seen as the worst carrier of all.
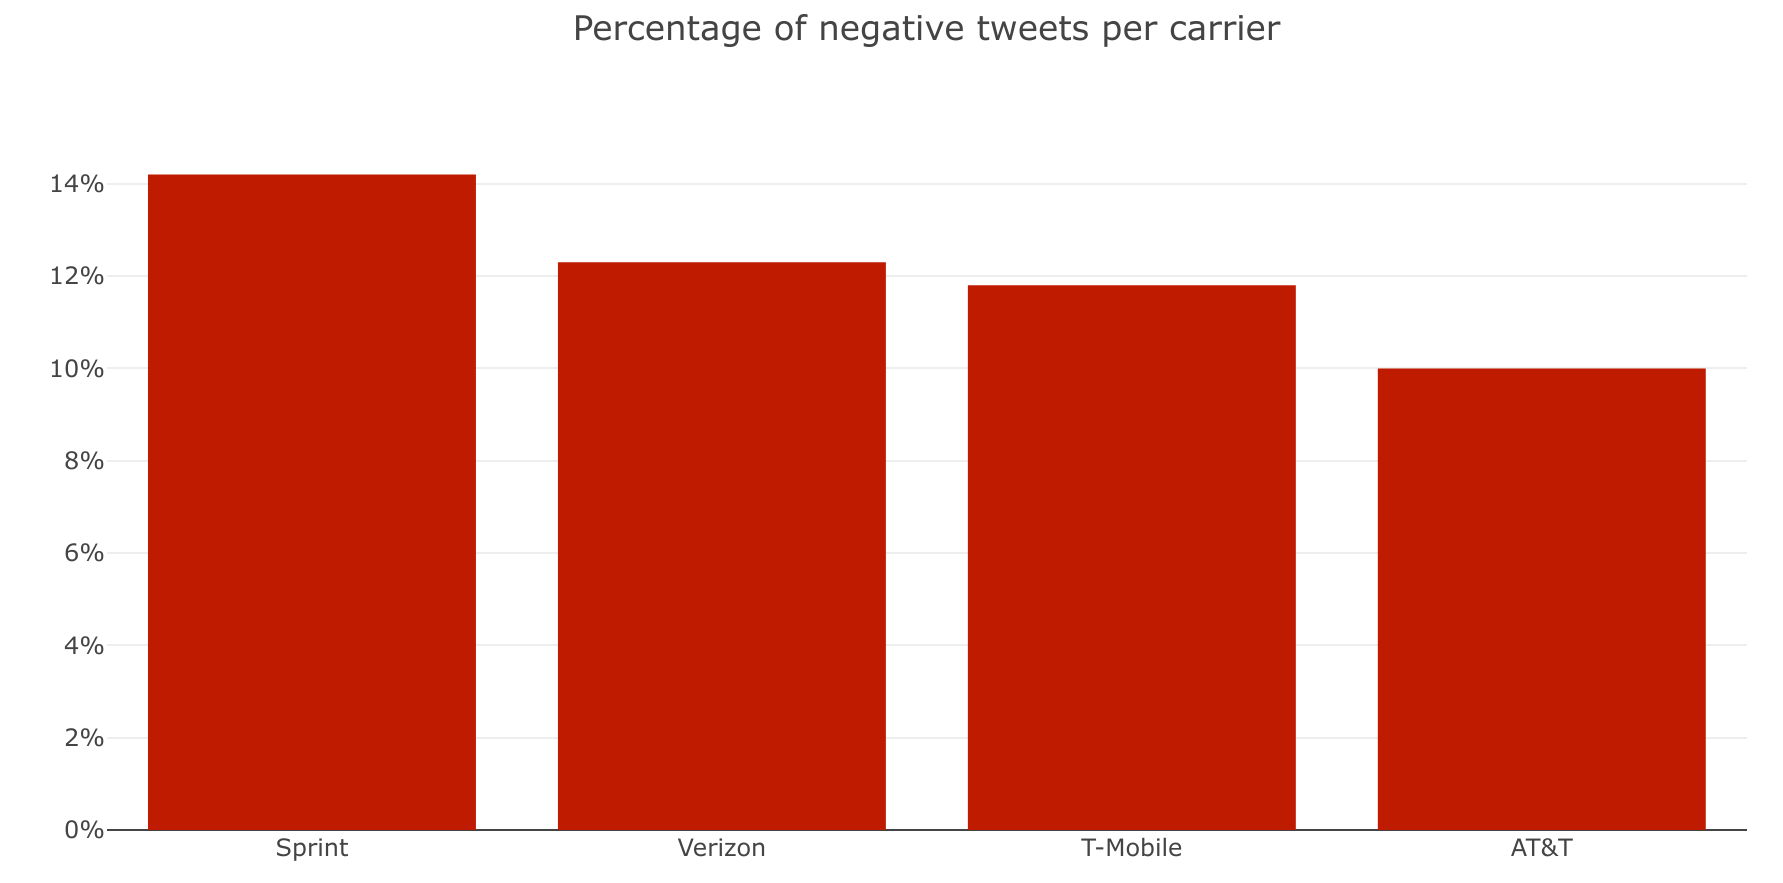
Percentage of the tweets mentioning a telco that are negative.
As for the others, AT&T has about the same for both tags (positive and negative), and T-Mobile is the one that fairs the best. Sprint is ahead of the pack in negative tweets (14%), which combined with their 15% of positive tweets indicates that it’s the company where the most people have a strong opinion on — either positive or negative.
Keywords and insights
So, what are these tweets actually about? We know that tweets mentioning T-Mobile are consistently more positive than those mentioning AT&T and Verizon, but what are they talking about?
Our tool here (besides, you know, reading all 200,000 of them) is our spanking new Insight Extractor. This extractor will read all the texts (in this case, tweets) you send as one unit, and extract the most relevant keywords. Then, alongside each keyword it will also return the most relevant sentences that include that word. This is very useful for an analysis such as this one, since we will know what are people talking about and also have some context for each topic.
In this case, we will separate our tweets by carrier and by sentiment, and send them to the insight extractor to see what people are saying. This will give us which comments telcos have in common and which are unique to each.
Negative Tweets
Starting off with negative insights, we found out that every carrier shares the same common complaints — bad customer service, bad reception, and high prices. Did I mention bad customer service? People love to complain about that one on Twitter.
We found many tweets saying something along the lines of ‘Verizon sucks! I’m moving to AT&T’, while also finding ‘AT&T sucks! I’m moving to Verizon’. So this looks like a case of the grass always being greener on the other side.
Now, there were some insights that only appeared in one of the four carriers — these are complaints unique to a single carrier. For example, T-Mobile was the only one where people complained about the quality of their LTE service, while Verizon was the only one where people complained about their ‘Unlimited plan’ (which apparently isn’t unlimited).
Positive tweets
So, to compare the carrier with the most positive tweets — T-Mobile — and the one with the least positive tweets — Verizon — we looked at the insights of the tweets labeled as positive. Verizon’s keywords were something to be expected: things like “better network”, “new phone”, “rewards”, “thanks”, “quality customer service” and so on. The related sentences were regular interactions between the guys at support and the customers.
Now, looking at T-Mobile, the picture changes. Many keywords here are the names of the members of the customer support team -- indicating that users are engaging highly with them and addressing them on a first name basis. Looking at their tweets with replies page, it’s clear that their game is on another level, with gif replies and emojis being common, and engaging on seemingly unrelated topics with users, such as anime girls. Compare with Verizon’s tweets: very dry and professional, the expressions of sentiment feel forced and almost fake. This really makes a difference with their customers.
Final words
We downloaded and analyzed thousands of tweets of the biggest phone carriers in the US to find out what people were saying about them. We performed sentiment analysis using MonkeyLearn, which allowed us to have a direct view on how these commenters were feeling.
What we learned was surprising, but not unexpected if you think about it: a friendlier, younger take on social media elicits more positive responses, in turn improving customer satisfaction.
We also found out that most complaints are the same across different telcos; the situation gets equally bad for everyone no matter their carrier.
This same analysis could be performed with other industries. For example, we could analyze how popular different airlines are on social media. Or after an event, what are the things that people liked and disliked about it. The possibilities are endless. Got ideas for further uses of this tool? Share them in the comments!

Bruno Stecanella
October 5th, 2017


