Structured vs Unstructured Data: What’s the Difference?

Data is growing by leaps and bounds every day – some of it is structured, but the large majority is unstructured.
Estimates say that just 20% of data is structured, while unstructured data accounts for 80-90% of data.
Start analyzing unstructured data
Both types of data are collected, processed, and analyzed in different ways, yet, with the same goal of extracting information to make data-driven decisions. So what exactly are the differences between structured and unstructured data?
What’s The Difference Between Structured and Unstructured Data?
Structured data is organized and fits tidily into spreadsheets and relational databases. Unstructured data, on the other hand, has no predefined construction or systemization. It comes in text form, audio, images, videos and, and can be challenging to analyze.Key Differences: Structured Vs Unstructured Data
| Structured Data | Unstructured Data |
|---|---|
| Structured data is quantitative and is often displayed as numbers, dates, values, and strings. | Unstructured data is qualitative data and includes text, video, audio, images, and more. |
| Structured data is stored in rows and columns. | Unstructured data is stored as audio, text, and video files, or NoSQL databases. |
| Estimated 20% of business data. | Estimated 80-90% of business data (and growing!). |
| Found in closed-ended surveys, like NPS and CSAT scores, and web analytics. | Found in customer support queries, online reviews, email messages, open-ended questions, and more. |
| Stored in data warehouses. | Stored in applications, NoSQL (non-relational) databases, data lakes, and data warehouses. |
| Reveals patterns and trends that show you what’s happening. | Reveals patterns and trends that explain why something is happening. |
| Requires less storage space. | Needs more storage space. |
| Easy to analyze with tools like Excel. | Hard to analyze without AI tools. |
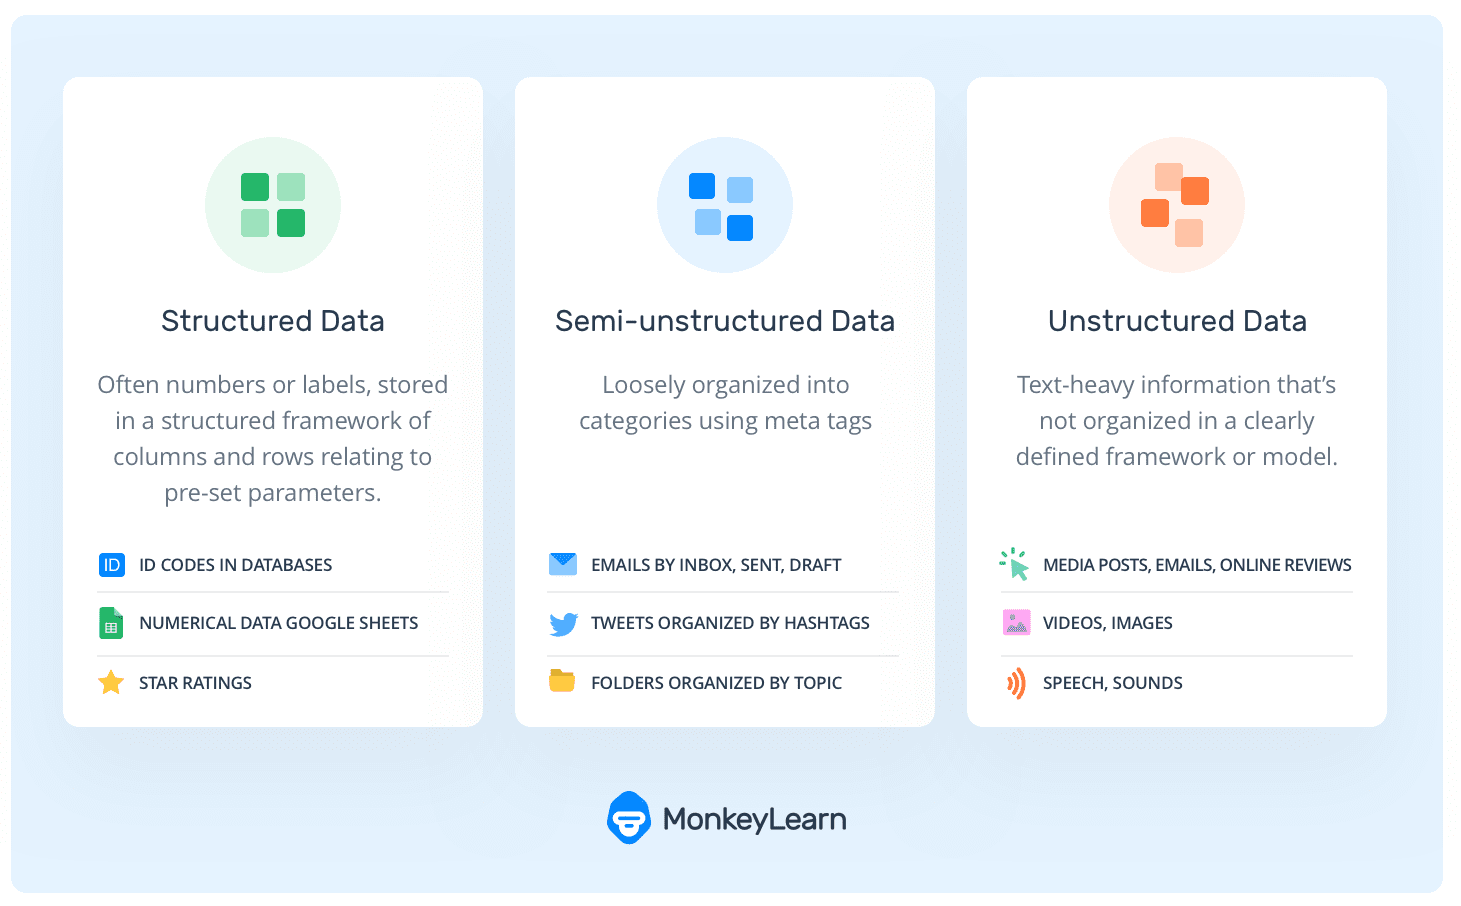
In between these two types of data is semi-structured data, which has some loose organizational framework. For example, email is an example of semi-structured data because it's partially organized into folders, but the body text within emails is unstructured.

What Is Structured Data?
Structured data is quantitative, highly organized, and easy to analyze using data analytics software. It’s formatted into systems that have a regular design, fitting into set rows, columns, and tables.
Structured query language (SQL) is the standard language used to communicate with a database and is particularly useful when handling structured data. Used to search, add, update, and delete data, among other uses, SQL makes it easy to organize structured data.
Think of a hotel database, where you’re able to search guests by name, phone number, room number, etc. Or bar codes used to organize and classify products at the production, distribution, and point-of-purchase level.
Structured data is generally contained in relational databases (RDBMS). The information within the databases could be entered by humans or machines and is easily searchable by manually entered queries or algorithms.
Highly methodical programs like Excel, are also used to store and organize structured data, and can easily be connected to other analytical tools for further analysis.
Structured data is great for basic organization and quantitative calculations, but must fit into rigid, preset parameters. Examples of structured data are data points that are easily searchable within their set structure and can be cross-referenced with other databases. You could search by customer address to discover which products are most popular in a certain location or find out which products are ordered multiple times by multiple customers.
Structured data does have its disadvantages, however:
- It isn’t great for truly granular insights: the “Hows” and “Whys” of data analytics.
- It’s not flexible: structured data is generally stored in data warehouses, which have rigid schemas. If you want to make even small changes to the schema ‘blueprint’, you’ll need to reorganize large amounts of data, which incurs huge costs and time.
What Is Unstructured Data?
Unstructured data is information that has no set organization and doesn’t fit into a defined framework. Examples of unstructured data include audio, video, images, and all manner of text: reports, emails, social media posts, etc.
Finding insights within unstructured data isn’t easy, but when properly analyzed, text data can be extremely valuable to extract qualitative results, like customer opinions, or organize business data, like customer service tickets, into individual categories to be routed to the proper employee.
What Is Semi-Structured Data?
There is also semi-structured data, which contains mostly unstructured text, but is loosely categorized with “meta tags.” An example of this would be email, which you can search by Inbox, Sent, Drafts, etc. Or social media that may be categorized as Friends, Messages, Public Posts, Private Posts, etc.
Semi-structured data can be easily broken down into its predefined categories, but the information within these categories is, itself, unstructured.
When analyzing emails, intent classification can be helpful to automatically read business emails for the intent of a customer to tell you if they are responding to a query with genuine interest or not.
How to Structure Unstructured Data?
While structured data fits neatly into spreadsheets and relational databases, unstructured data can present several problems when attempting to sort it because the formats and locations can vary widely. However, with the help of text analysis software, unstructured data can be automatically formatted and properly analyzed.
Text analysis software, like MonkeyLearn, uses machine learning algorithms and natural language processing (NLP) techniques to “read” unstructured text, then categorize and analyze it as a human would, but in a fraction of the time and with total accuracy.
Often, text analysis software will perform a variety of NLP tasks on unstructured data, to gain more accurate insights. A typical unstructured data analysis workflow with MonkeyLearn involves the following text analysis techniques:
Topic Classification to automatically read customer support tickets for subject, urgency, and more, and route them directly to the proper employee.
Sentiment Analysis to read for the polarity of opinion (positive, negative, neutral, and beyond). Once properly trained, sentiment analysis models can tell you the actual feelings of your customers.
Entity Extraction to automatically understand text data and pull out names, addresses, phone numbers, and other specific information.
Keyword Extraction to automatically read through customer feedback and extract the most used and most important words. It can be performed constantly and in real time to always keep an eye on your brand.
The Take Home
Whether structured or unstructured, data should be at the heart of every business decision.
Structured data provides a view into individual customer habits or quantitative trends, but when you learn to properly organize and analyze unstructured data, the insights increase exponentially. You’ll see how qualitative data results can provide much more useful information.
Go beyond mere numbers and statistics to actual keywords, accurate classifications, and full-blown opinions. Follow your brand status regularly, in real time, and over time. Find out what’s working and what’s not for product releases and marketing campaigns, and perform competitive analysis.
Request a demo from MonkeyLearn and discover how you can use this AI-equipped business intelligence software to analyze and transform unstructured data into useful business insights.

Tobias Geisler Mesevage
August 26th, 2020


