9 of the Best Tools for Survey Analysis in 2022

Whether you want to measure customer satisfaction, employee loyalty, or send any kind of questionnaire, surveys are the perfect way to gather feedback from your target audience.
When analyzed correctly, you'll find insights within your surveys which you can then use to inform important business decisions.
Survey analysis is an essential part of your survey process and without it your survey data won't count for much. This means equipping yourself with the right survey analysis tools is crucial.
There are a wide range of tools on the market all offering slightly different things. Here we'll go through 9 of the best tools to help you find the one that best suits your needs.
Start using survey analysis tools
Survey Analysis Tools
To help you learn more about the different tools on offer, we've broken each one down using the following:
- Who it's best for
- The pros
- The cons
- The price
Now, let's jump straight into the top 9 survey analysis tools:
1. MonkeyLearn
MonkeyLearn is a text analysis software that harnesses the power of AI and machine learning to sort through reams of text data to give you insights in a matter of seconds. This saves you from having to manually analyze text responses and therefore saves you a lot of time.
MonkeyLearn also offers different templates for different data types (like reviews and surveys).
For example, the NPS analysis template is pre-set to include the following three analysis techniques to organize your open-ended survey responses: keyword extraction, topic analysis, and sentiment analysis
Finally, MonkeyLearn's templates bring you data visualization, allowing you to filter by sentiment, topic, keyword, and more.

Book a demo to see how to create your own dashboard.
Best for:
Those who want to gain quality insights from their data, quickly and efficiently.
Pros:
It has a no-code interface, so you don't have to be a data expert to use MonkeyLearn.
It's easy to use.
It integrates easily with survey tools via a bespoke API.
Cons:
- If you want to read through every survey response you get and manually code your themes, this is not the right tool for you as MonkeyLearn automates these steps.
Price:
Learn more about pricing and plans here.
2. Excel
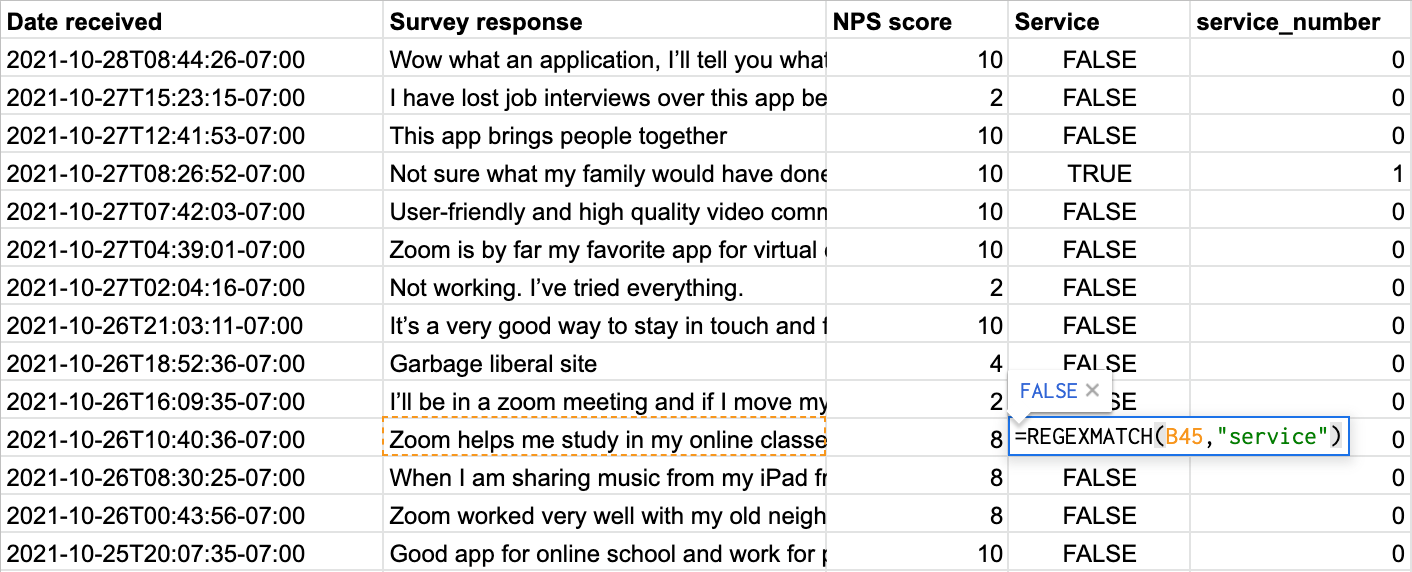
Excel is a well-known spreadsheet tool that's handy for survey analysis. Perhaps you already use it to analyze the quantitative data in your surveys using filters, pivot tables, and built in formulas.

But did you know you can also do some basic text mining, using REGEX formulas?
For example, if you wanted to find out how customers are talking about customer support in open-ended responses, you could search for words like 'service' using this formula =REGEXMATCH(C2, "keyword"):
Best for:
People looking to perform quantitative analysis and those who have a small amount of qualitative data they want to analyze.
Pros:
You're probably already quite familiar with Excel and the Microsoft suite. In fact, you might already have it on your desktop.
It also can be easily integrated with survey tools like SurveyMonkey and Typeform.
Cons:
Excel is first and foremost a spreadsheet tool, not an analysis tool. Therefore it's ability to perform analysis is limited.
While you can automate using formulas, the formulas only allow for basic coding. You can, for example, code for specific keywords that exist within your data, but you can't code for themes in the way that a machine learning model can. This means you could potentially miss a lot of useful insights.
It is also true that the more data you throw at it, the slower it will go.
Price:
Excel can be purchased as part of a Microsoft 365 package or as a single product. There is also a free (but limited) online version. You can find more information here.
3. Crunch.io
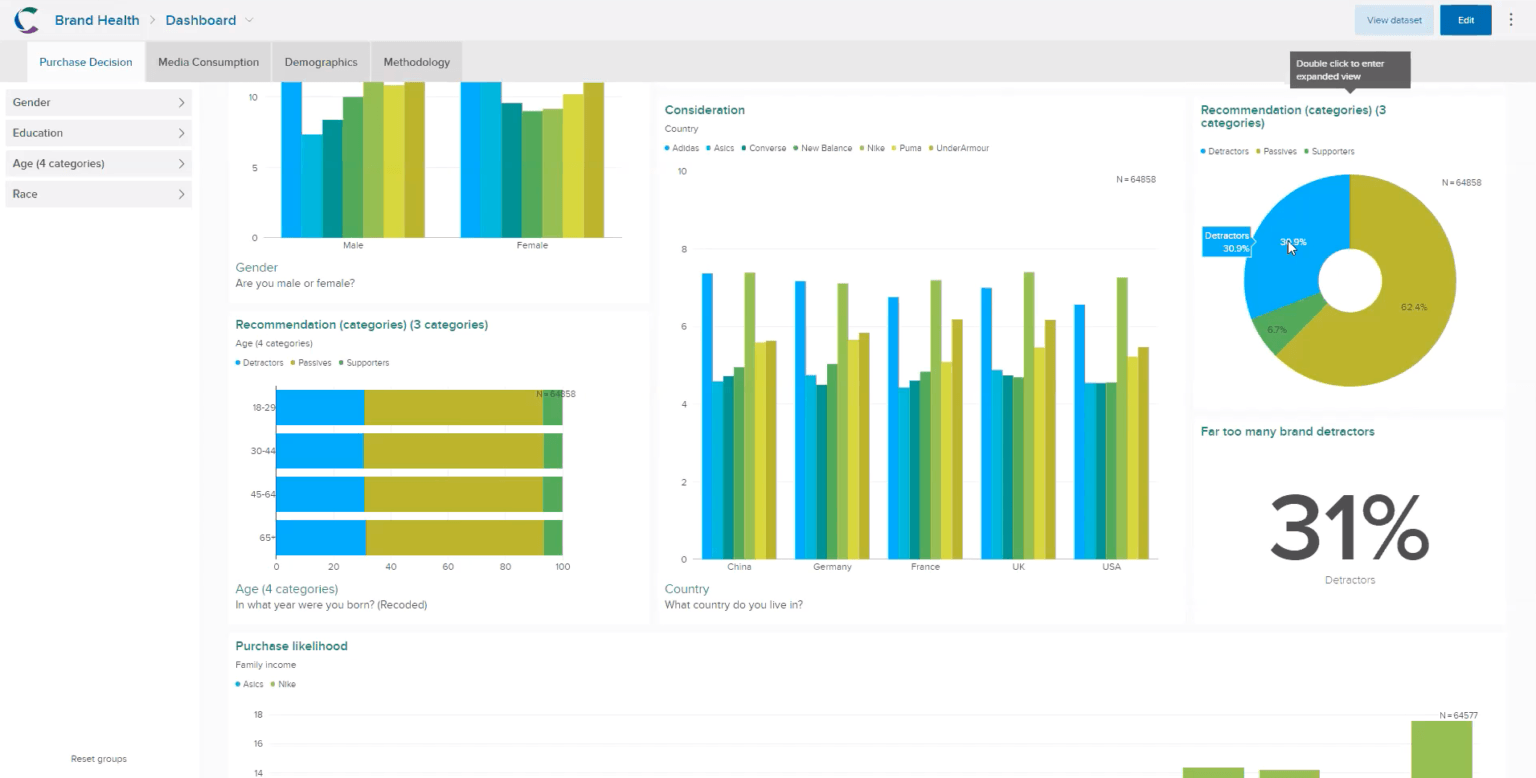
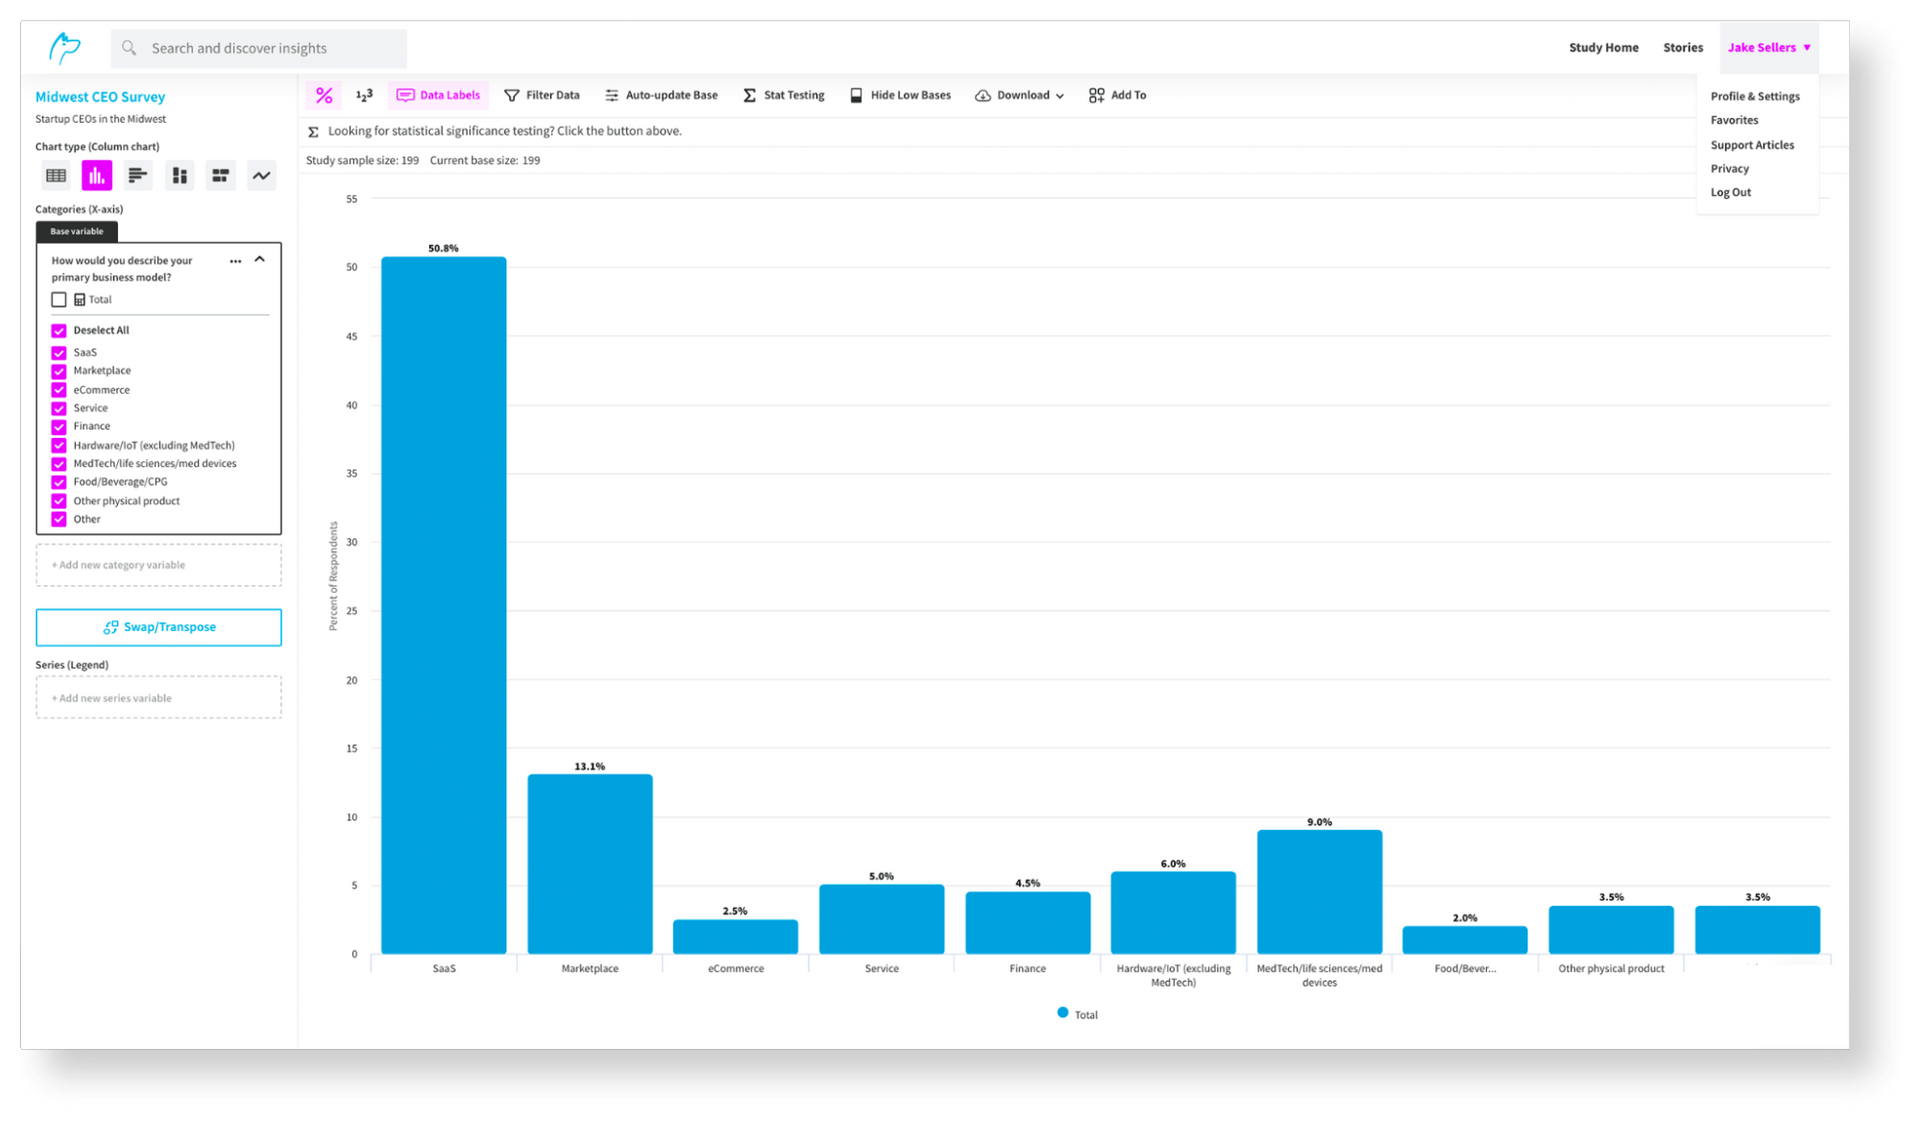
Crunch.oi is a web based, self-service survey data analysis tool that crunches numbers and visualizes your data in easy-to-build interactive dashboards. It is a subsidiary of YouGov, the survey and market research company. They offer integrations with SurveyMonkey, Confirmit, and Decipher.
It's easy for beginners to use, but it also allows for experienced data experts to run more complex statistical analysis using R and Python.
Best for:
Market Researchers who need powerful survey analytics.
Pros:
The drag and drop dashboard functionality makes it simple to create dashboards without needing to code.
You can easily export your visualizations to powerpoint.
It has a search function to quickly find research based on keywords.
It's also easy to create and view crosstabs.
Cons:
- While it is exploring using some machine learning techniques, it's core focus is statistical analysis. If you're looking for a tool that fully harnesses the power of AI, a tool like MonkeyLearn or Thematic would be a better fit.
Price:
For a free demo or information about pricing plans, you can contact Crunch.io here.
4. NVIVO
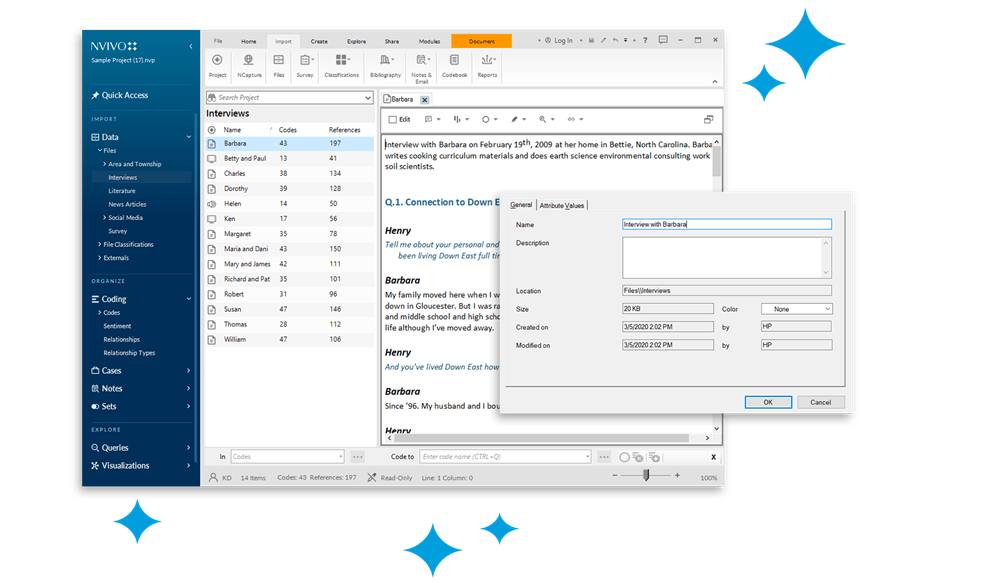
NVIVO is a qualitative and quantitative analysis software that lets you analyze all kinds of data from a number of sources. It allows for both manual analysis and some automated analysis.
It is predominantly a desktop-based technology, however they do offer their NVivo Collaboration Cloud module which makes it easier to share insights across teams.
Best for:
Academics and researchers who want the option of manual analysis.
Pros:
User friendly interface that has a familiar, Microsoft-like feel.
It integrates easily with programs like SurveyMonkey.
The recent updates have made it easier to work with larger datasets thanks to some autocode features using sentiment analysis.
Cons:
While it offers some automation it lags behind software like MonkeyLearn and requires you to do some manual analysis. If you have very large amounts of data, this would be impossible without hiring their research consultants or using more team members.
It has a slightly old-fashioned feel and can feel clunky and not intuitive for those used to more modern software.
It's not cloud based.
Price:
NVIVO offers different packages for academics, non academics, students, individuals, and organizations. You can find more info here.
5. MarketSight
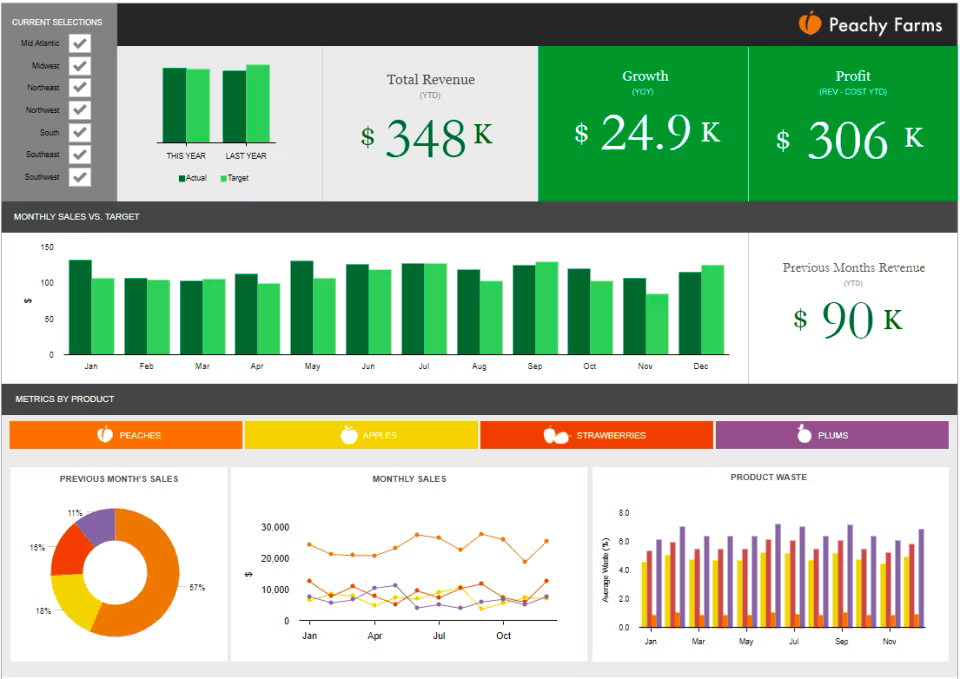
MarketSight is a cloud-based platform that is specially designed to analyze survey data. It also comes with data visualization capability, crosstabs, advanced analytics, and more.
Best for:
Researchers who have experience dealing with data and statistics.
Pros:
It can handle large datasets efficiently.
It integrates with most survey applications and reads data found in documents like excel spreadsheets.
It offers APIs so you can integrate insights easily into your systems and products and automate certain processes.
Cons:
Some users have reported that the user interface is not that intuitive and it could be a steep learning curve for those who are not familiar with qualitative research.
It also doesn't make use of AI technology as much as other tools like MonkeyLearn and Thematic.
You have to pay more to be able to customize your reports.
Pricing:
MarketSight offers a number of different packages where you can pay more to gain more features. You'll find more information here.
6. SPSS Statistics
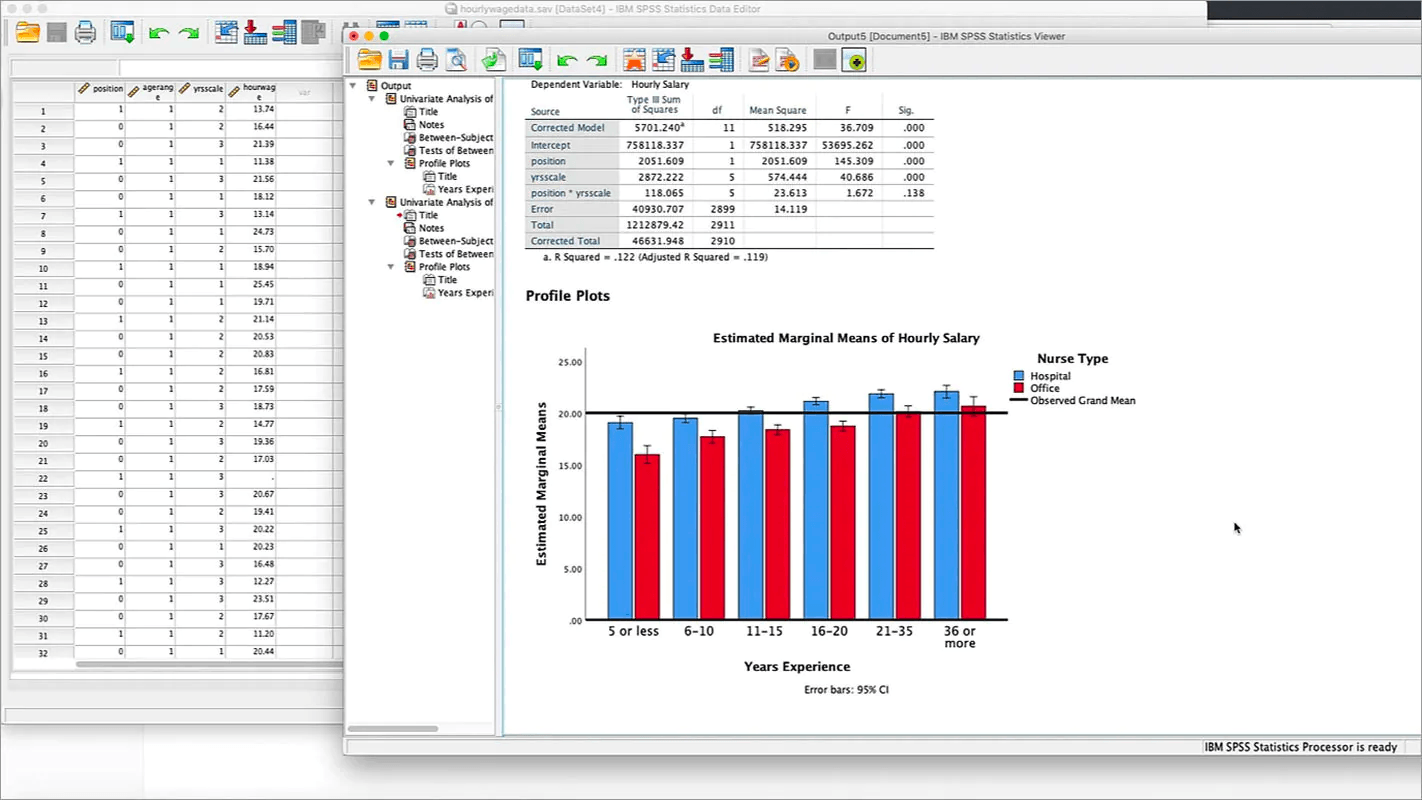
SPSS Statistics is a statistical software platform that helps you prepare your data, analyze it, and then create reports. It also performs predictive analysis to give you an idea of what's coming next.
It was originally created for those in social sciences, and remains popular in those fields. It's predominantly used by governments, psychologists, and health professionals.
Best for:
Researchers in the field of social sciences.
Pros:
It's easy to get started and doesn't require programming, this makes complicated statistical modeling accessible to non-statisticians.
It offers a syntax editor which makes running statistical analysis easier. It also saves your analysis steps so you can replicate the same analysis in the future on subsequent surveys.
Cons:
Some customers have commented that it struggles with very large data sets.
Users have reported that it can be slow.
The reports that you can create in SPSS do not allow for much customization.
The visualizations that you get with SPSS are also basic. You won't find the fancier dashboards you might get with software like Displayr or MonkeyLearn.
Pricing:
They offer a free trial, then both a subscription and a perpetual payment plan as well as a special edition for academics. More info here.
7. KnowledgeHound
KnowledgeHound is a data analysis tool that imports your survey data into a proprietary database, then adds a search engine, and a data visualization tool.
From there you can then search your new database to find the answers you need to your business questions. You can also see these results in a visualization.
KnowledgeHound integrates with the main survey tools, like SurveyMonkey, and runs multi-project analysis. They have said their customers refer to them as the "Google of market research".
Best for:
Market researchers who want to analyze their structured survey data.
Pros:
The user interface is intuitive and the action required from the user is simple. This means that it can be used by people who are not data experts.
It pulls together all of your data in one database you can then search
Their latest feature is a text analytics capability which applies a sentiment score to open-ended survey answers.
They have a free trial site
Cons:
- It can't search unstructured data, it can only search structured data found in data files.
Pricing is not available but they've just released a new trial site.
8. Displayr
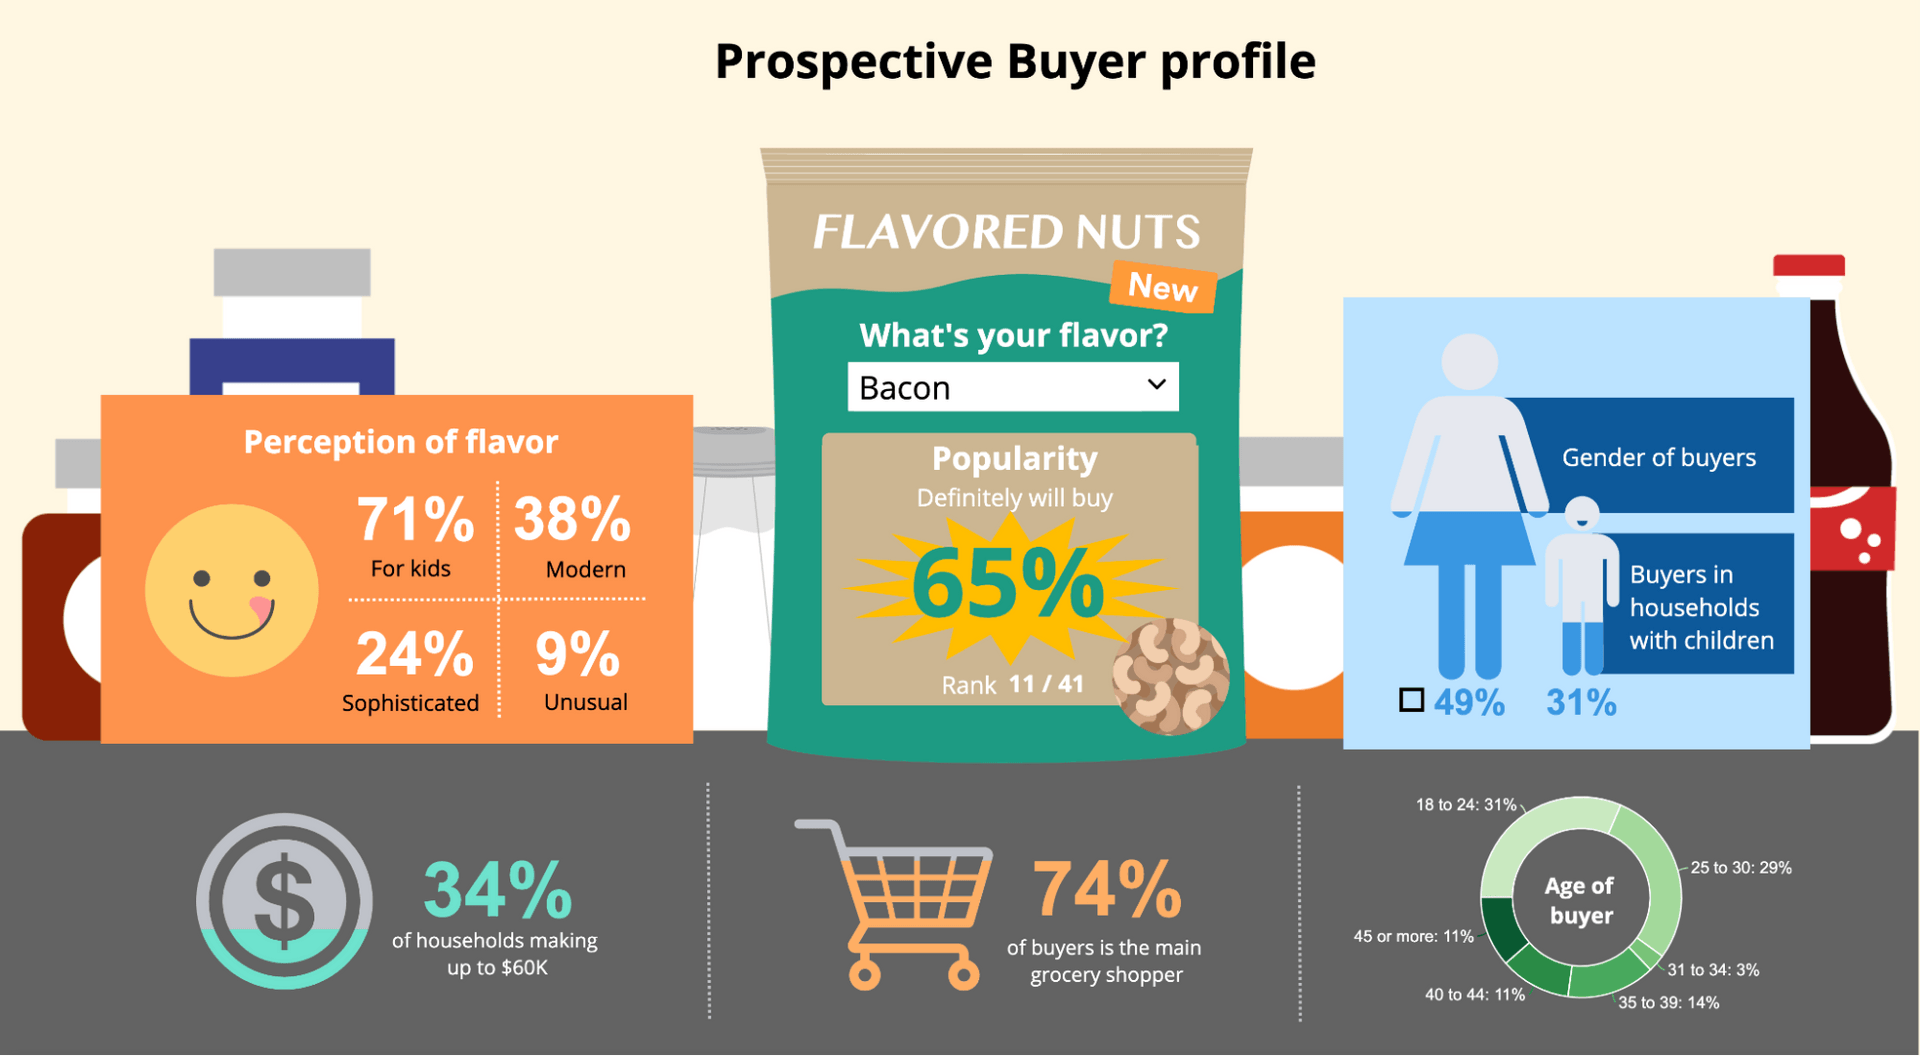
Displayr is an online tool designed to analyze and report on survey data. It provides visualizations and dashboards. It offers a wide range of analysis tools including some machine learning text analysis capabilities.
Best for:
Market researchers looking for aesthetically pleasing dashboards.
Pros:
The dashboards are drag and drop which makes them easier to build.
The dashboards they offer have great designs.
They have a sentiment analysis tool.
Cons:
- It has some tools that help with automation. They also provide workarounds that cut down on manual analysis, but you still have to do some manual analysis and organizing of your tables and charts.
Pricing: Displayr offers a free option as well as a paid professional and enterprise version. You can find out more here.
9. Thematic
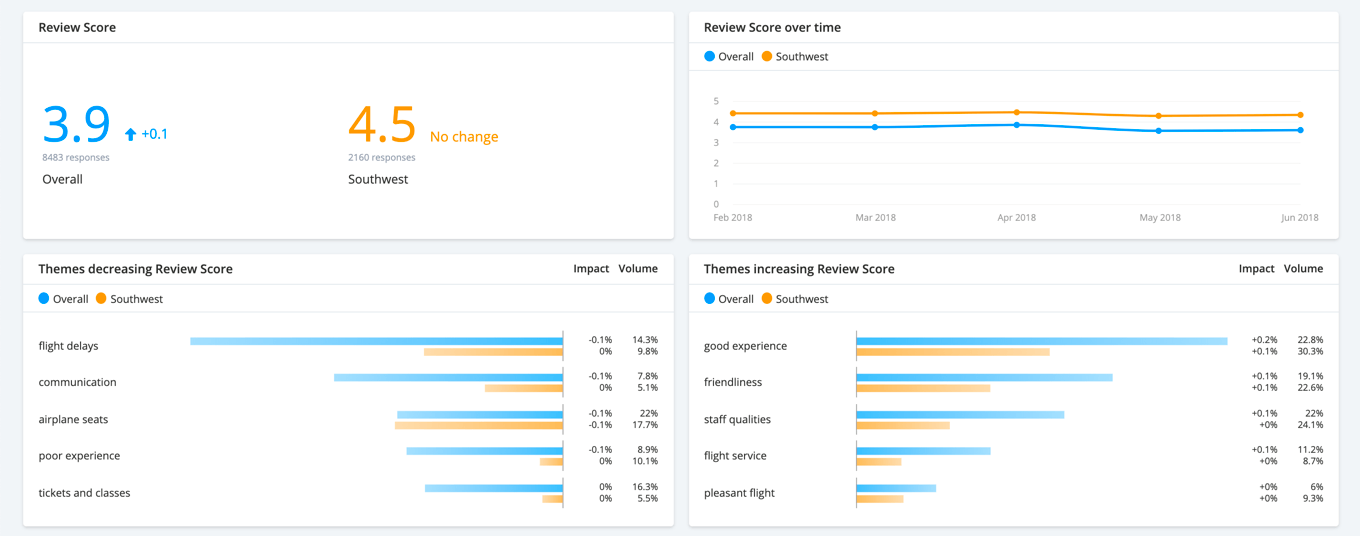
Thematic is a feedback analysis tool that uses AI, specifically natural language processing, to help you sort through your data. It also has visualization and dashboarding capabilities. It integrates with survey tools like SurveyMonkey and Typeform.
Best for: Companies looking to automate their customer feedback analysis. Or as they put it: "made for teams at data-driven companies."
Pros:
It is powered by AI which makes it faster and more efficient.
They are themselves open to customer feedback. In the past, customers had complained of a not so user friendly UI. Thematic have since improved.
Cons:
Some customers have reported that the setup phase can take a while. You have to train the system to recognize your keywords and some have reported this taking much longer than they expected.
It's also significantly more expensive than tools like MonkeyLearn, which offer a similar service to Thematic.
They only offer an integration with Zendesk. If you want to connect to sources like Salesforce, you'll have to do that yourself.
It doesn't connect to data warehouses.
Pricing:
They offer three different pricing plans, one for projects, one for teams, and one for enterprise. You can find more details regarding pricing here.
And... that's a Wrap!
The survey analysis tool you ultimately choose will come down to your needs, your industry, your data expertise level, and your preferred way of working.
However, if you're looking for a no-code solution that suits both data experts and data novices and that offers powerful automation with great visualizations, then MonkeyLearn is the best option.
Sign up today, or try a free demo to see how you can use MonkeyLearn to transform survey data into insights that bring improvements to your organization and your customers.

Rachel Wolff
January 21st, 2022


