How to Analyze Open-ended Responses for Powerful Results

Whether giving public opinion surveys, political surveys, customer surveys, or interviewing new employees or potential suppliers/vendors, asking direct questions and getting responses with new information is key to making decisions about who to work with and how to run your organization.
Surveys and questionnaires with Yes/No, number scaled, or multiple-choice (close-ended) response options can be easy to implement and easy to calculate, but they don’t give you a whole lot of information because the possible responses are pre-set.
Allowing your customers and employees the opportunity to give open-ended responses can prove to be much more fruitful, offering greater detail and more opinions.
- What Are Open-Ended Responses?
- Open-Ended Responses Vs. Close-Ended Responses
- How to Analyze Open-Ended Responses
What Are Open-Ended Responses?
Open-ended responses are responses to questions that can’t simply be given as Yes/No, with a fixed multiple-choice response, or on a scale (e.g., On a scale of 1 to 10 how happy were you with your visit today?).
Open-ended questions are worded to provoke longer, open-ended, free form responses, and generate more – often subjective – information from the respondent. Open-ended responses are explanatory and offer more insight than close-ended responses.
They often come from questions that begin with “How?,” “Why?,” and “What do you think [about…]?” and explain the respondent’s POV, in their own words.
Open-Ended Responses Vs. Close-Ended Responses
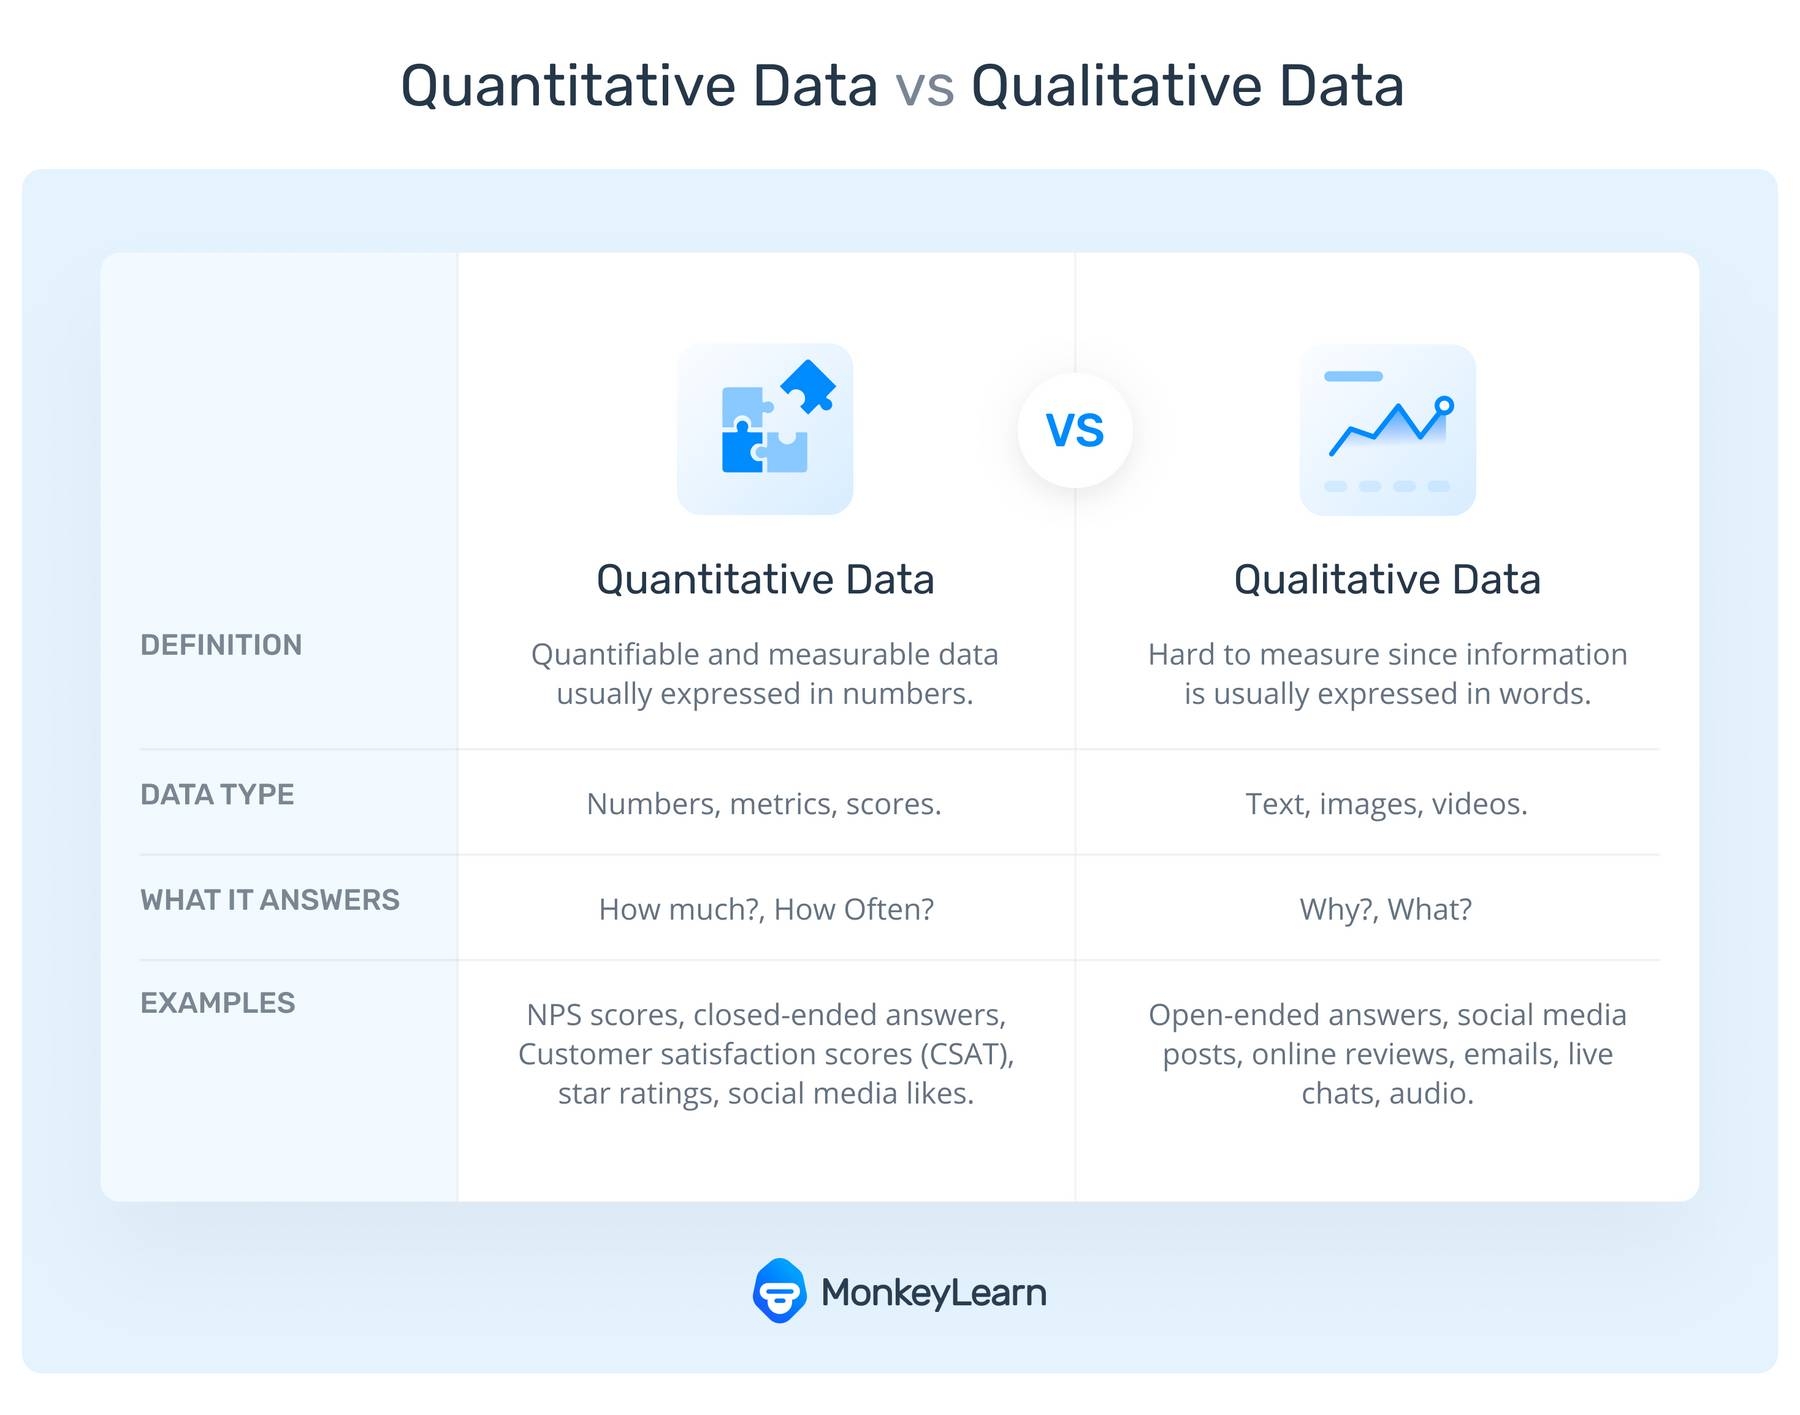
Close-ended responses come from the kinds of questions that can be answered with a one-word answer: “Yes/No,” “True/False,” “1 to 5 stars;” or with pre-selected multiple-choice options. Close-ended responses offer quantitative feedback or structured data, which is expressed with number values and can be calculated to show statistics, percentages, or counts.
Open-ended responses don’t have a limited pre-set of possibilities. Open-ended responses offer qualitative feedback – the feelings and opinions of the person responding. Open-ended responses offer free-form data in the unique language of the respondent. Open-ended responses often offer extra valuable information that the questioner may have never even considered.
Close-ended survey responses still present great data that can be quickly and easily analyzed, but it’s restricted only to the questions and responses that have been created by the interviewer, so the questions may be leading and the responses skewed or insufficient.
Examples of Open-Ended Vs. Close-Ended Responses
One common example of a survey with both close-ended and open-ended questions is a Net Promoter Score (NPS). The first question asks:
“How likely from 0 to 10 are you to recommend [this product or service] to a friend or colleague?”
Then, there’s the option to follow up with an open-ended question, to dig into the details:
“Why did you choose the number you did?”
Here are some more examples showing how you could expand a close-ended question to elicit more information:
Q: From 1 to 10 how would you rate your experience?
A: 1
Q: Tell us about your experience today.
A: It was terrible. I called ahead and asked if you still had [X product], then when I arrived at the store there weren’t any left, and the staff just ignored me.
Q: Did our product/service meet your needs?
A: Yes.
Q: What can we do to improve our product/service?
A: Nothing really. I love it. It would be great if it were available on the West coast, though, because I keep telling my family how great it is!
Q: What is your favorite feature?
- Usability
- Price
- Scalability
- Security
- Integrations
A: 4
Q: How do our features help you achieve your goals?
A: Security is my #1 priority and you go above and beyond the competition, just wish it could integrate with my fingerprint login.
If you’re attempting to turn a close-ended question into an open-ended question, it’s important that you don’t simply tack on something like, “...and why?”
For example, “Does our product meet your needs and why?”
This is likely to only elicit a response like, “Yes. Because it does what it’s supposed to.”
Instead think about how you can word your question for an open-ended response with real opinions, like the above, “What can we do to improve our product?” Because, even if the customer had a great experience, there’s still likely room for improvement.

How Open-Ended Responses Back Up Close-Ended Responses
Combining both close-ended and open-ended responses allows your business to get the overall NPS metric and compare it to your competition, but also allows you to dig in a bit more and understand the reasoning behind your customers’ NPS responses.
Close-ended (quantitative) responses offer numerical results that can quantify your sales, performance, market share, product success, etc., for data that’s mathematical, objective, unbiased, and able to be easily compared to other, similar data.
Open-ended (qualitative) responses, on the other hand, uncover the why and how behind the “what happened” of numerical data. Open-ended responses allow you to truly focus on your customers – understand the customer experience (CX) and follow the whole customer journey by allowing your customers to open up and explain their pain points and favorite aspects of your business in their own words.
How you write an open-ended response is completely up to the respondent, so you’ll often get original ideas and innovative concepts. However, because open-ended questions offer more detailed, completely unknown information, they can be a bit harder to analyze. But follow the steps below, and gain actionable insights in no time.
How to Analyze Open-Ended Responses
Analyze your open-ended responses with artificial intelligence (AI) – the key to getting the data you need from open-ended responses in surveys, social media, emails, pretty much anywhere you might seek them.
SaaS text analysis tools, like MonkeyLearn make AI accessible to everyone, so you can analyze thousands, or hundreds of thousands, of open-ended responses quickly and completely accurately for immediate results.
Save hundreds of hours of manual annotation and analysis with automated open-ended responses analysis. Follow this tutorial to see how it’s done:
- Collect your open-ended responses: use online survey tools to gather data
- Structure your open-ended responses: pre-process your unstructured data
- Analyze your open-ended responses: machine learning performs with utmost accuracy and saves time and money
- Visualize your results: get the most from your open-ended responses with data visualization tools
1. Collect your open-ended responses
Online survey tools, like SurveyMonkey, Typeform, and Google Forms simplify the process of creating and sending questionnaires and gathering open-ended responses. Easy-to-use templates make customizing surveys simple, for the open-ended data you need.
2. Structure your open-ended responses
With online survey tools, you can output your open-ended customer feedback data to a CSV or Excel file to set it up for automatic analysis. From there, you just need to do a little data cleaning, so that machines can process it: spell check, remove symbols and emojis, and other AI-guided techniques.
3. Analyze your open-ended responses
See machine learning work its magic. Connect MonkeyLearn to survey tools or other open-ended response data via the MonkeyLearn API. Or use Monkeylearn’s integrations with Zapier, Zendesk, Freshdesk, and more, to pull data from tools you already use. Once you’ve connected MonkeyLearn to your data streams, you’ll have dozens of analyses to choose from, like:
- Sentiment analysis – automatically classifies your open-ended responses as Positive, Negative, or Neutral.
- Topic analysis – classifies open-ended responses by “aspect” (category, topic, feature, etc.).
- Aspect-based sentiment analysis – a combination of both of the above, to understand what aspects of your product or service are performing positively, and which negatively.
Sign up to MonkeyLearn to take a look at other powerful text analysis tools.
4. Visualize your results
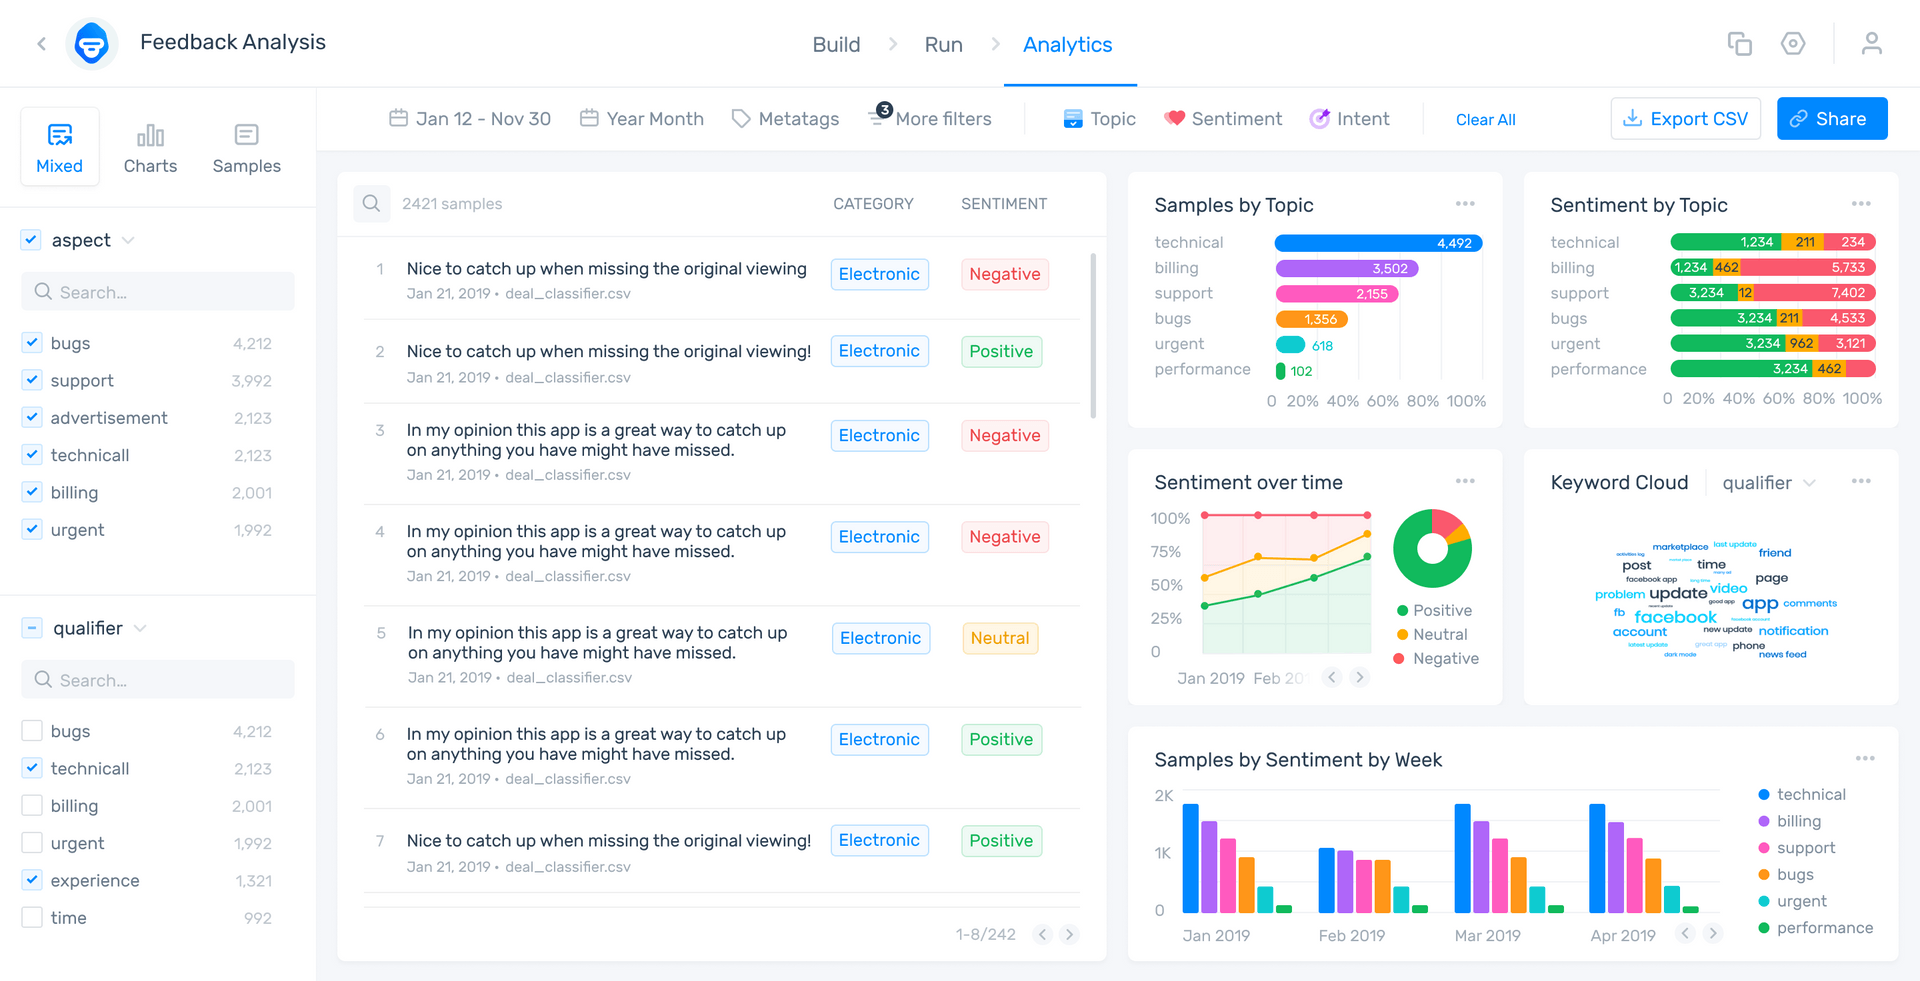
MonkeyLearn Studio is a data analysis and visualization tool that shows your results in a striking and easy-to-understand visual dashboard. You can dig into the minute details or see a broad overview of your open-ended response data.
Once your analyses are set up, you can change or tweak them right in the MonkeyLearn dashboard, so you no longer have to be downloading and uploading between apps. Take a look at the MonkeyLearn aspect-based sentiment analysis of reviews of Zoom below. It’s a lot of data but much easier to digest with charts, graphs, and the ability to change criteria.

Take a look at the MonkeyLearn Studio public dashboard, click around, and see how it works. It’s a powerful, all-in-one tool to take you from open-ended response analysis to data visualization.
Get the Most Out of Your Open-Ended Responses
Close-ended surveys undoubtedly offer strong results, are easy to calculate, and can help make important business decisions. Surveys and questionnaires that offer close-ended responses with qualitative data, however, allow you to more thoroughly understand your customers.
Analyzing close-ended responses will help you follow the entire customer journey, so you can close the customer feedback loop to cut customer churn and increase retention.
MonkeyLearn’s suite of text analysis tools are easy-to-use and designed to tackle all forms of open-ended response analysis. Sign up to try MonkeyLearn’s tools for free or schedule a demo and we’ll show you how t o use MonkeyLearn on your open-ended response data.

Rachel Wolff
January 20th, 2021


