What Is Survey Data Processing?

Designing and distributing the perfect survey can take a lot of precious resources.
So, it's important that you get a return on this investment, in the form of insights that get you closer to your business goals.\ Insights come when you analyze your data. But how can you make this analysis as smooth and productive as possible?
Survey data processing is a crucial step before you begin your analysis.
In this guide we'll take you through what survey data processing is, why you need to be doing it, and how to do it.
Let's get started.
- What Is Survey Data Processing?
- Why Is Survey Data Processing Important?
- How to Process Survey Data
- Takeaways
What Is Survey Data Processing?
Survey data processing is the act of converting raw data into structured information that can then be analyzed for insights.
Responses from surveys can come back to you in a range of different formats with inconsistent responses, missing values, and more.
By processing your survey data, you are fixing those errors and formatting the information so that it is consistent.
It's important to note the difference between data cleaning and survey data processing.
While data cleaning is a part of the data processing phase, processing your survey data emcompases more than just cleaning. Data processing is also concerned with converting your raw data into a usable format.
Processing survey data can be tedious and repetitive, and requires meticulous attention to avoid artificially skewing your results and insights.
But when you process survey data correctly you will save yourself time further along the road. Let's delve into why that is now.
Why Is Survey Data Processing Important?
Processing your survey data before analysis is crucial for gaining consumer insights that you can use to make changes and improvements to your organization.
This is because analysis is most effective when the data you are using is organized, clean, and well structured. Raw data is the exact opposite of all of this and can include bad, or "dirty data."
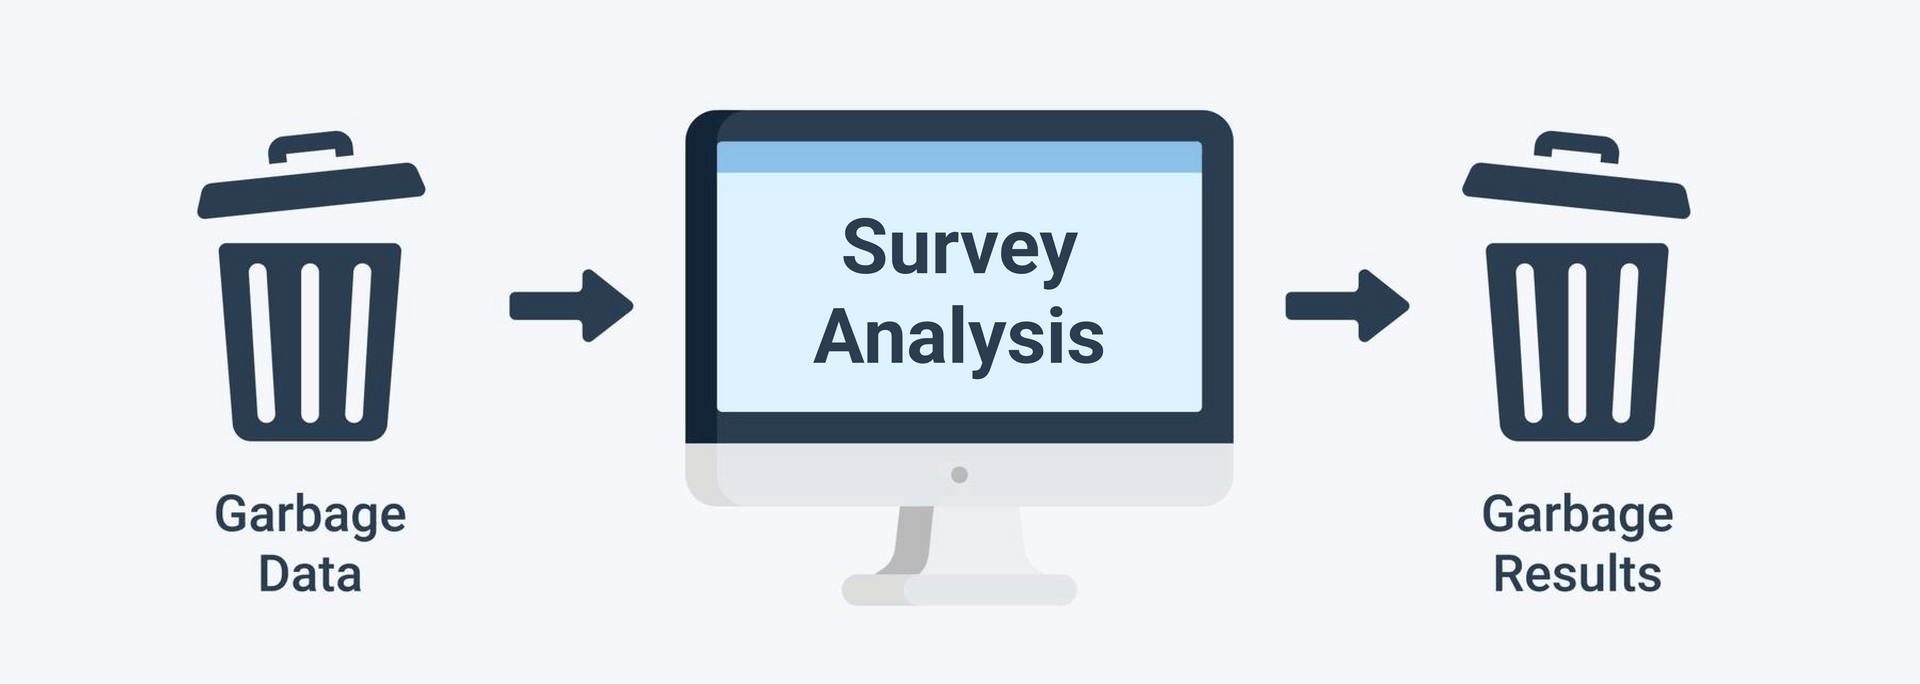
The garbage in, garbage out analogy is an easy way to see that if you use bad quality data, whether using machine learning tools or analyzing survey data manually, you'll get bad quality results.

And as MonkeyLearn CEO and Co-Founder, Raúl Garreta puts it:
"If your downstream processes receive bad data, the quality of your results will also be bad."
Not only will your survey results be bad if you use bad data, you'll also waste time and other resources. This is because you'll have to go back and correct issues you could have fixed as part of a preprocessing phase.
Given insights from survey data are useful for making important business decisions, you want to make sure you're not using bad insights.
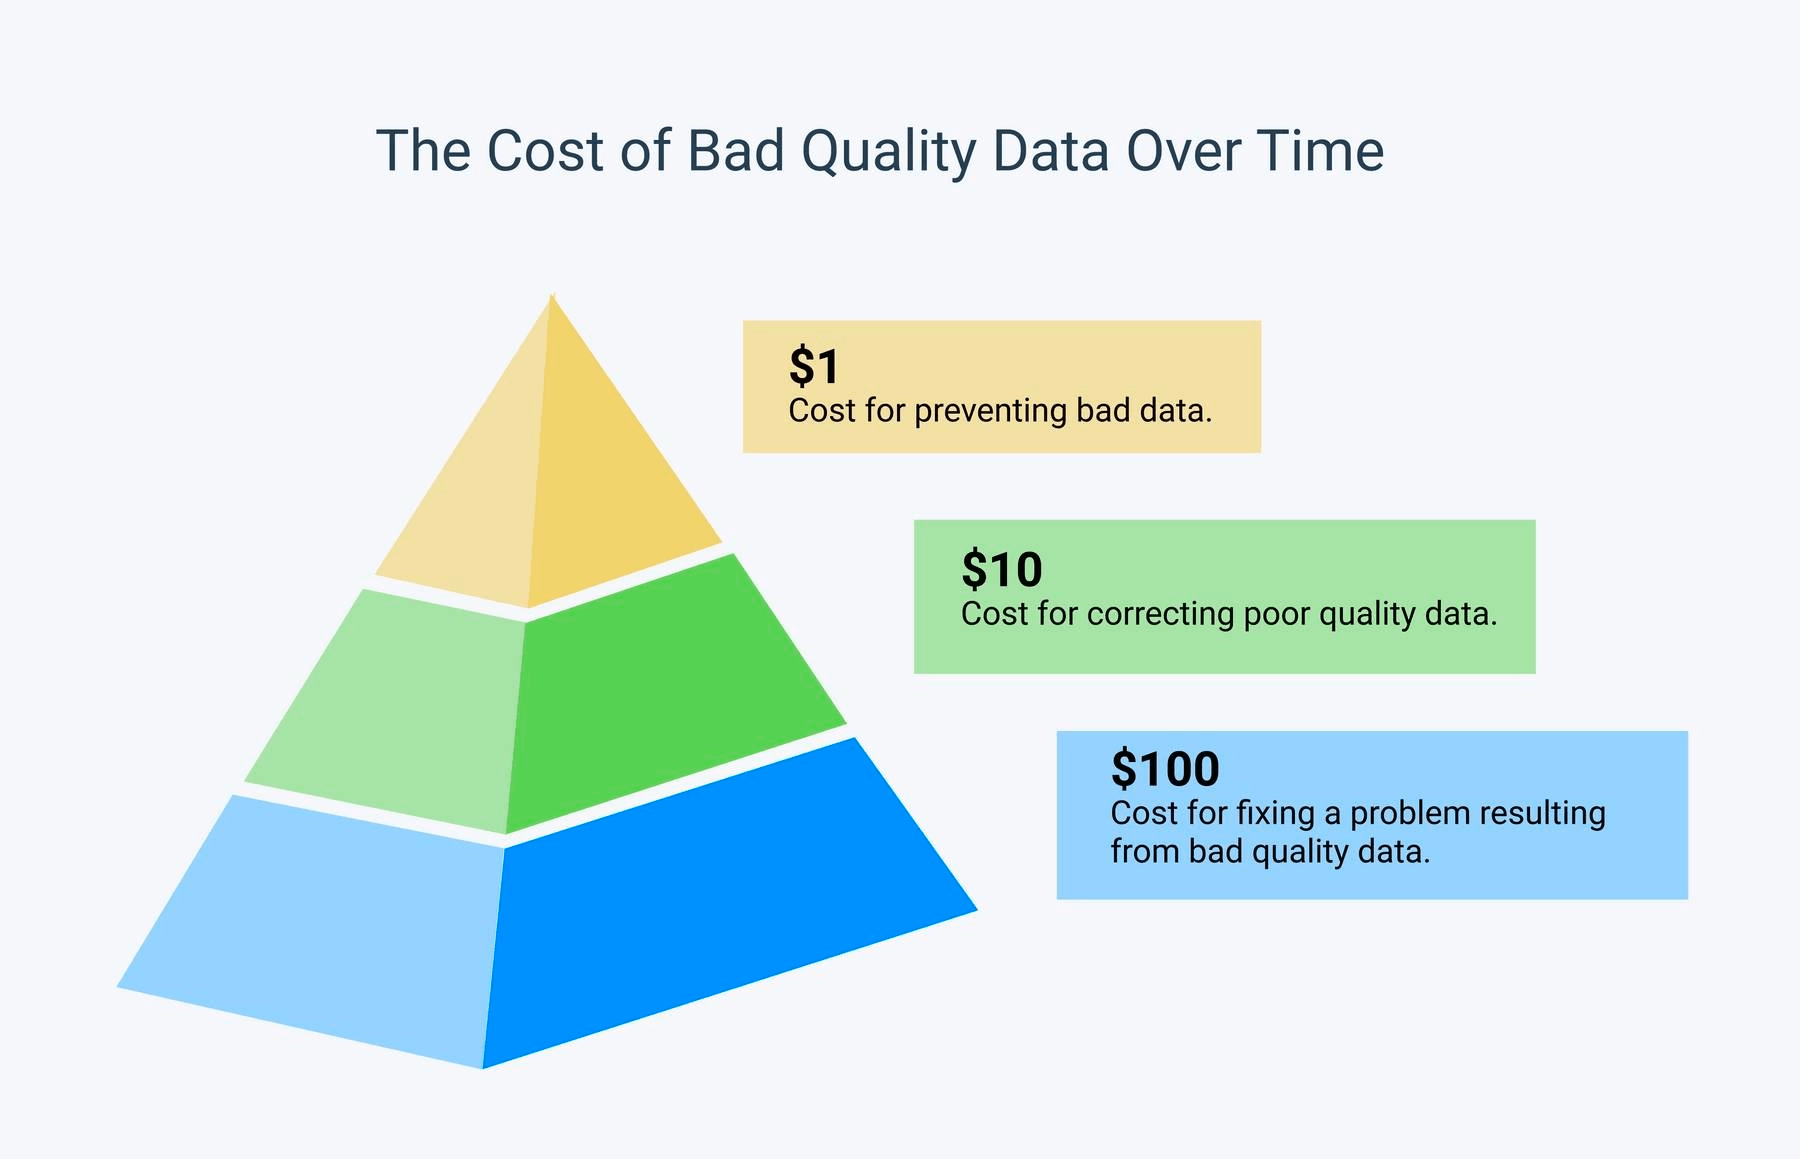
The graphic below explains clearly how the cost of bad data can increase incrementally the longer you leave survey processing.

It's evident that the best cost-benefit decision is to prevent bad data from going anywhere near your analysis process.
How to Process Survey Data
The following 4 steps can help you process your survey data effectively and methodically:
1. Quality Assurance
Quality assurance should be present in your survey process from the very start. It's especially crucial during survey data processing.
Think of this step as the exploratory phase. It is here that you are first checking the general quality of your survey results. What you discover in this step will inform any corrections or changes you need to make in later steps -- and is likely to inform how you collect data in the first place to keep bad quality results to a minimum.
You'll need to be systematic when performing your quality assurance to make sure you cover all bases.
This will involve taking steps to check the following:
- Making sure that all respondents have answered the questions correctly.
- Reviewing for incorrect information and reliability
- Identifying mismatched data types
- Checking for missing information or fields
- Identifying data outliers.
- Depending on your data you might also want to check your sample deviation index which measures how much your sample deviates from your target population.
2. Data Cleaning
Data cleaning is the step where you start actually changing the data to get it ready for analysis.
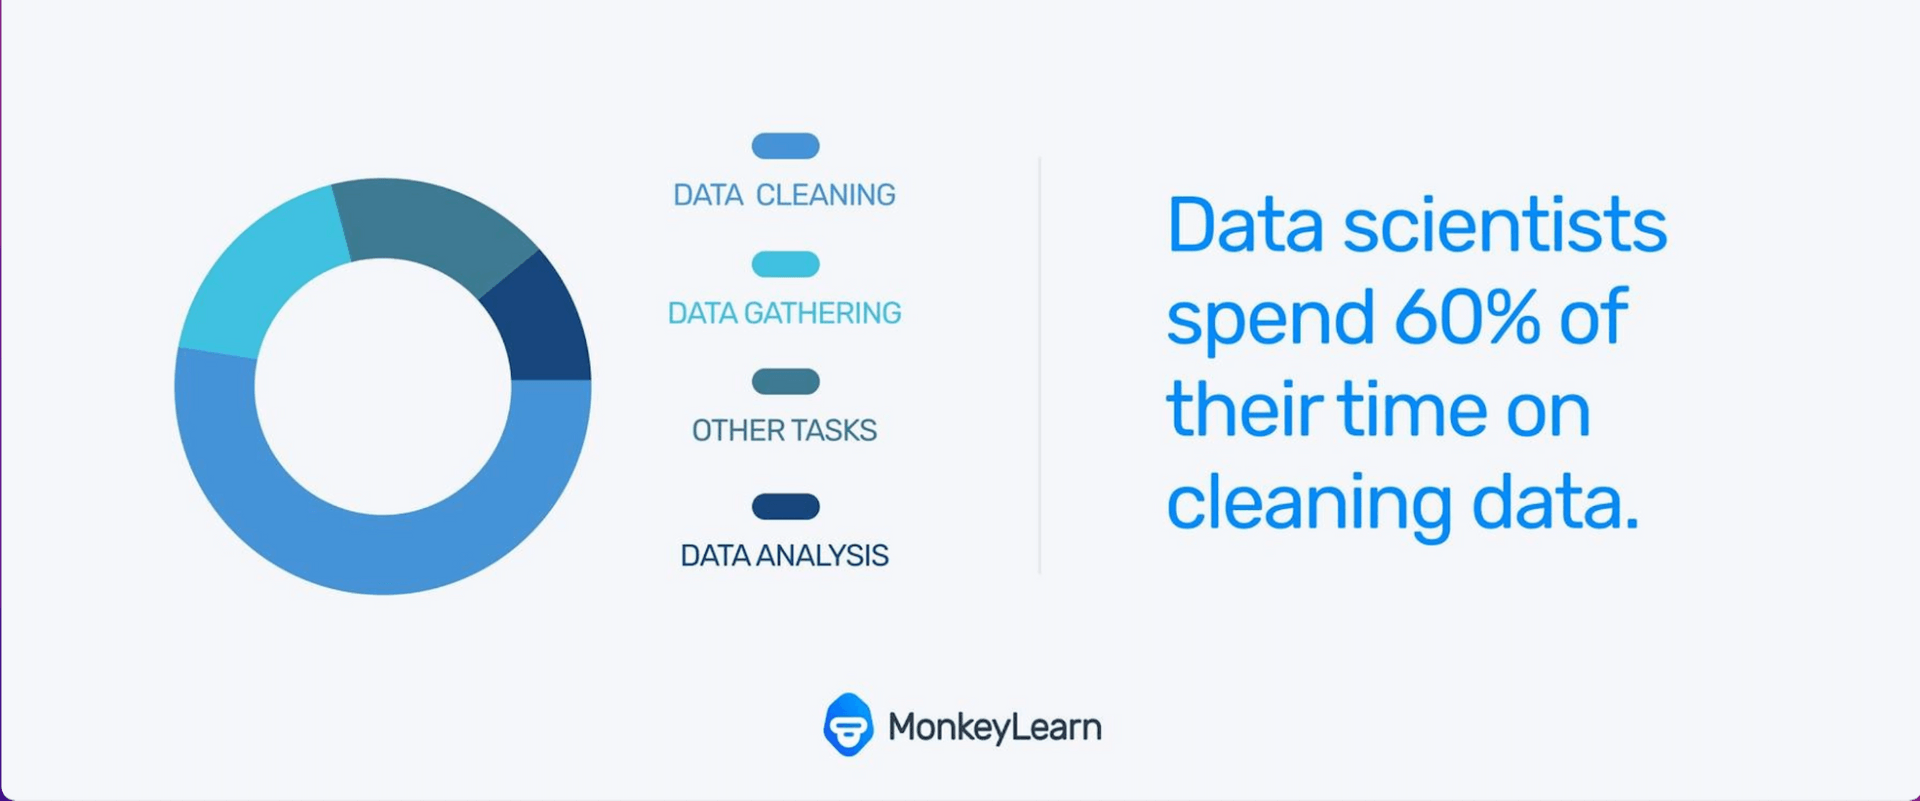
It will occupy a large amount of your time when processing survey data. But, it will make your analysis run much smoother.

When cleaning your survey data, you should be looking for these key 5 areas:
1. Time Spent Answering The Survey
This is important because if respondents are moving too quickly through the survey it can indicate that they are not that engaged. It can also show that they are not reading your questions properly.
Most survey tools will give you an average time respondents spent completing your survey. You should review all responses against this time and if there are any that seem suspiciously fast, take a closer look with the view to remove them.
2. Duplicates
Duplicates can happen for a range of reasons. It might be that the respondent pressed submit one too many times, or the page didn't load properly.\ Duplicates can easily be identified when you filter your results. It's important to remove them, otherwise you risk inaccurately skewing your results, or just adding noise that obscure insights.
3. Outliers
Outliers are survey results that don't fall in line with the rest of the results. For instance if 9 of your survey respondents are female but 1 is male, you might need to disregard the man's answers.
Data outliers can be detected by plotting your responses on a scatter plot. This will show you which responses fall far from the majority.

The regression line on a scatter plot shows the connection between scattered data points in a set of data. The outlier can easily be spotted because it's usually farther away from the regression line
In this table below we can see that the majority of respondents are female and are aged between 20-30. The outlier here is the 89 year old man which would be clearly evident on a scatter plot.
| Name | Sex | Age |
|---|---|---|
| Florence Fred | Female | 21 |
| Zoe Guy | Female | 29 |
| David Jones | Male | 89 |
| Annie Lewis | Female | 25 |
| Sofia Gonzalez | Female | 28 |
4. Nonsense Data
This might look something like: ddffggh. Nonsense data can be as a result of a respondents error. It can also happen when the respondent is trying to fill out the fields with anything in order to advance through the survey as quickly as possible.
You will need to assess these on a case by case basis. Then, to remove you can tag all of the answers that make sense and filter out the nonsense responses without tags.
5. Missing Data
Sometimes respondents skip entire questions when answering surveys.
This can happen if they want to move quickly though they survey. It can also indicate that the survey was too long, the questions were difficult to answer, or that the respondent wasn't equipped to answer the question.
Not all responses with missing data should be deleted all together.
Let's look at this example below:
| First name | Last name | Email address | How satisfied were you with your experience? | We'd love to hear more about your experience |
|---|---|---|---|---|
| Zoe | 2. Very unsatisfied | The store assistant was rude when I asked for help so I found the item on my own. | ||
| Joyce | Butler | jj453@gmail.com | ||
| Sofia | Gonzalez | sg2020@yahoo.com | 4. Somewhat satisfied | I found what I needed quickly but I wasn't asked if I needed help. |
We can see that Zoe has not added her last name or email address, however, her other answers provide insight on her customer experience. Her responses should not be deleted because of some missing fields.
Joyce on the other hand has added his personal information but nothing else. His results can probably be deleted.
Finding and tackling missing fields is normally a question of filtering your results, then analyzing them on a case by case basis to determine whether you can use the results or not.
6. Inconsistent Responses
Inconsistent responses arise when respondents give contractitory answers.
An example of inconsistent responses would be if a respondent answered one question saying they have no pets. Then in another question they said they take their dog out for a walk twice a day.
These answers need to be analyzed carefully as they may not be able to be trusted as accurate and may need to be deleted.
3. Data Transformation
This is the step where you actually perform all the necessary changes to the data to have it ready for analysis.
You can transform your data using all or some of the following techniques:
- Aggregation is the process of combining all of your data in a uniform format.
- Normalization scales your data into a range and leads to standardized data with no duplicate entries.
- Feature selection is where you decide which variables are important to your analysis and which you'll want to use to train your machine learning models.
- Discreditization sorts data into groups or intervals. For example, if you have a number of different ages such as 26, 29, 36, and 40 years old, you could sort them into groups of 25-34 years old and 35-44 years old.
- Concept hierarchy generation involves adding a hierarchy to your results. An example of this is if you had respondents living in Italy, Ireland, and Belgium, you could add the hierarchy of Europe to these results.
4. Data Reduction
The more data you have, the more difficult it is going to be to process it especially if you have hundreds of thousands of survey results.
With open-ended survey questions you normally get extra language that doesn't add to the answer or the insight. This can be removed so that it's easier to code the responses and reach your insights.
Another way you can reduce your survey data is by looking at the goals you set when you created your survey. If there are fields that aren't necessary to meet those goals, then you might be able to exclude them.
A plus to reducing your data is that you also reduce storage capacity needed and therefore your costs.
There are also times where you won't be able to reduce the amount of data you have and that is fine too.
Ready to Analyze Your Survey Data?
When you've followed the above survey processing steps, you'll then be ready to move onto the next step - survey analysis.
If you have a lot of survey results (i.e. upwards of 10,000) you'll need software like MonkeyLearn.
MonkeyLearn automatically analyzes and tags your survey data in a matter of seconds using the power of machine learning and artificial intelligence.
With a range of no-code templates that run different kinds of text analysis techniques such as sentiment analysis and keyword extraction, it's quick and easy to get insights.
Sign up for your free trial today and be ready to analyze your prepared survey results with the right tools.

Rachel Wolff
March 16th, 2022


