How to use AI to Auto-tag Responses in Typeform
You joined a cool startup a few months ago, and sales have been growing steadily. Your dev team has been shipping great features that your customers love. The support team is doing a kickass job, helping customers solve their issues and make the most out of your product. But suddenly, you notice a dramatic spike followed by a plateau and a slight decrease in sales…
Where did that come from? What does it mean? You’re at a loss to explain what happened.
However, fear not. There is a solution...Typeform is a tool that can help you understand customer behaviors so that there are no surprises around the corner. By running customer surveys, a company can gather useful insights from their target market and plan accordingly.
The thing is some trends, and the reasons behind them, seem out of reach because they are in the form of open-ended responses.
Yes, sometimes we conduct open-ended survey questions hoping to get a deeper understanding of the Voice of Customer (VoC), only to end up with an endless amount of responses that take hours to go through.
Don’t get us wrong. After hours of painstaking manual labor, we have some valuable insights to console ourselves with. Realistically though, it’s not scalable. How can we continue listening to our customers and learn from them without spending too many valuable hours reading responses?
Text analysis is a Natural Language Processing technique that can give you those valuable insights so that your team doesn’t have to spend hours reading individual responses to grasp opinions, topics and even urgency. Text analysis can do that, faster and at a more granular level.
Don’t worry; it doesn’t take a long time —and you don’t require coding knowledge— to perform text analysis on your Typeform responses. With this technique, you’ll have the answers to:
- How many responses include a good/bad opinion of my product/service?
- What do customers love about it?
- What features do they dislike about it?
- What problems need to be tackled ASAP?
Here, we’ll explain how you can find these answers with text analysis, which will complement Typeform to give you deeper insights into the VoC. It won’t take long —promise!— and you’ll learn the following:
- What is text analysis?
- How can it be useful?
- How to do text analysis of Typeform responses?
- Automate the whole process with Zapier
- Visualize the results
- Use cases and applications
Let’s dig in!
What is Text Analysis?
Text analysis —sometimes called text mining— is the automated process that enables machines to do different text-related tasks, like classifying and extracting information from text. This covers not only survey responses but also emails, support tickets, tweets and more, and it can be done in the form of topic detection, sentiment analysis or keyword extraction.
Topic detection is a type of text classification that is used for classifying pieces of text into different tags or themes that you can define in advance. These tags will vary depending on the business, so, for example, if your team asks questions such as ‘What do our clients think about the cost of our upgrade plan?’, ‘Do they think the app is convenient?’ or ‘Is the UI user-friendly?’, then you may want to use tags like Price, Customer Experience and UI to get the answers you’re looking for.
If you are hoping to get a picture of how many negative and positive survey responses you received, you may want to use another type of text classification: sentiment analysis. It automatically categorizes responses as either positive, neutral or negative.
Are you trying to gain even deeper insights? Then you can combine sentiment analysis with topic detection to create an aspect-based sentiment analysis system that will allow you to find out what is being said and how it’s being said.
If you want to understand why there’s a drop in sales, for example, you may prefer to run a keyword extraction to learn which words are mentioned most often in open-ended responses, AKA keywords. By doing so, you can learn that negative responses about your User Interface, for example, are mostly linked with words like intuitive, difficult or slow.
How Can It Be Useful?
Around 2.5 billion GB of data are created daily… and about 80 percent of that is unstructured. So it’s no surprise you feel overwhelmed with survey responses. Looking at the numbers, who wouldn’t? It takes time, energy, and it’s not very budget-friendly going through survey responses manually. That’s why a tool like text analysis can be of great use.
Implementing text analysis means automating those time-consuming and never-ending processes, condensing them into just a few minutes. And it works seamlessly in the background, so your team can make better use of their time by focusing on human-indispensable tasks. Moreover, text analysis provides these advantages:
- Scalability:
You go through one response at a time; clicking, reading, tagging, and routing… and you do it over and over again because you receive one batch of responses after another.
It’s not realistic for employees to spend many hours reading and categorizing each response. It’s possible, yes, but it can be a discouraging task, and it consequently leads to turnover.
With text analysis, this obstacle can be put to rest by processing text data automatically, and your team members can better spend their time on tasks that encourage teamwork and empower them to provide results.
- Real-time analysis:
Let’s say you notice a dramatic fall in sales and have no idea what’s causing this. You start analyzing data… manually, and have the results ready a few hours before the deadline. By then you may have lost even more sales and, who knows, maybe even customers. By having access to real-time analysis, you can dive into your data to get to the root of the problem in a matter of minutes, and take immediate action. Possibly deterring any further loss of sales, customers and time.
- Consistent criteria:
Imagine you get a survey response that says, ‘Despite its steep plan prices, I think it’s worth it because it’s a very user-friendly app’. You might think that this would be categorized under Price... but wouldn’t it also fit under UX? Although this type of hesitation is entirely human, it can lead to changeable criteria… which makes it harder to analyze data with certainty.
When a machine analyzes text , it always provides consistent criteria, defined by you, to ensure you are getting accurate insights over time.
How to Do Text Analysis of Typeform Responses?
Applying machine learning to your survey analysis is pretty straightforward. You don’t need to know how to code or have many hours to spare. Nonetheless, you’ll need to gather the responses before building text analysis models. Read on!
Gather the Survey Responses
1. Go to your Typeform Workspace and click on ‘Results’:

2. Now go to the ‘Responses’ section to the left and select the open-ended responses you want to download:

3. Then click ‘Download’ and select the format. You can choose either a CSV or an Excel file:

If you’re hoping to get the results on a Google Sheet, you can use the native Typeform integration. Just follow a few easy steps:
1. Go to your Typeform Workspace and click on the ‘Connect’ tab:

2. You’ll spot the Google Sheets icon straight away. Click on the ‘send your data’ option:

3. After doing this, you’ll have to connect to your Google account. To do that, follow the steps to sign in and click on ‘Allow’ so that Typeform can modify your spreadsheet.
4. Choose whether you want to send the responses to a new spreadsheet or an existing one.

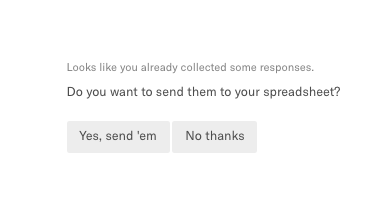
5. Do you already have some responses you’d like to send to your spreadsheet? Then click on ‘Yes, send ‘em’. If that’s not the case, click ‘No thanks’.
6. You’re done! Just click on ‘Save and continue’ and your data will automatically enter your spreadsheet.
Sentiment Analysis of Typeform Responses
Your open-ended responses are ready to be analyzed, so what happens now?
Well, you could create a sentiment analysis model to automatically detect how positive, neutral or negative responses are.
On one hand, you can use a pre-trained model for sentiment analysis. Pre-trained are great to get started right away with sentiment analysis. On the other hand, if you care about accuracy, you can you’ll have to train a sentiment analysis model with your own data, so that it can learn the nuances of your domain as well as your criteria, for example, what you consider positive and negative.
In this simple tutorial, you’ll learn how to train, test and try out your own sentiment analysis model in a few simple steps.
1. Create your sentiment analysis model
Once you’ve signed up for free to MonkeyLearn, you can start building your machine learning model.
First of all, you’ll need to select ‘Create Model’ on your Dashboard. The following options will appear:
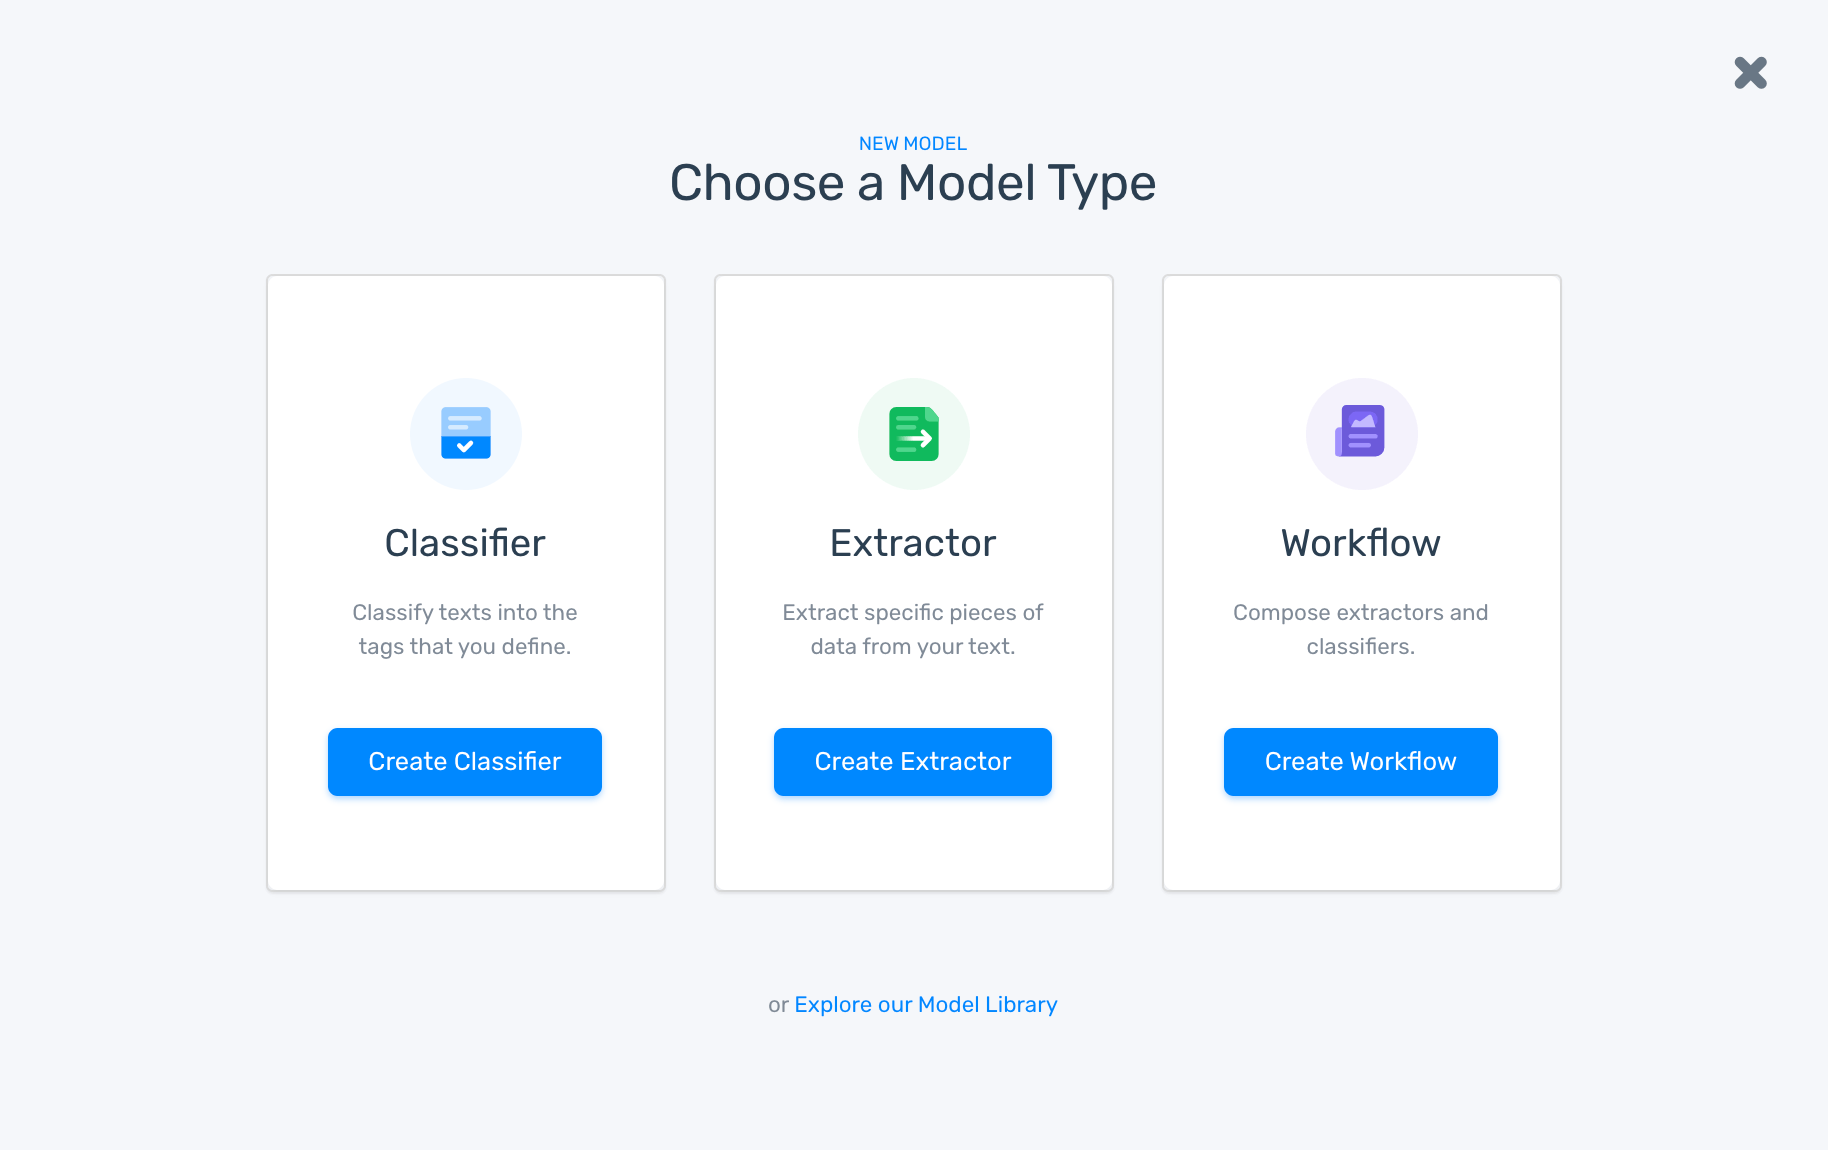
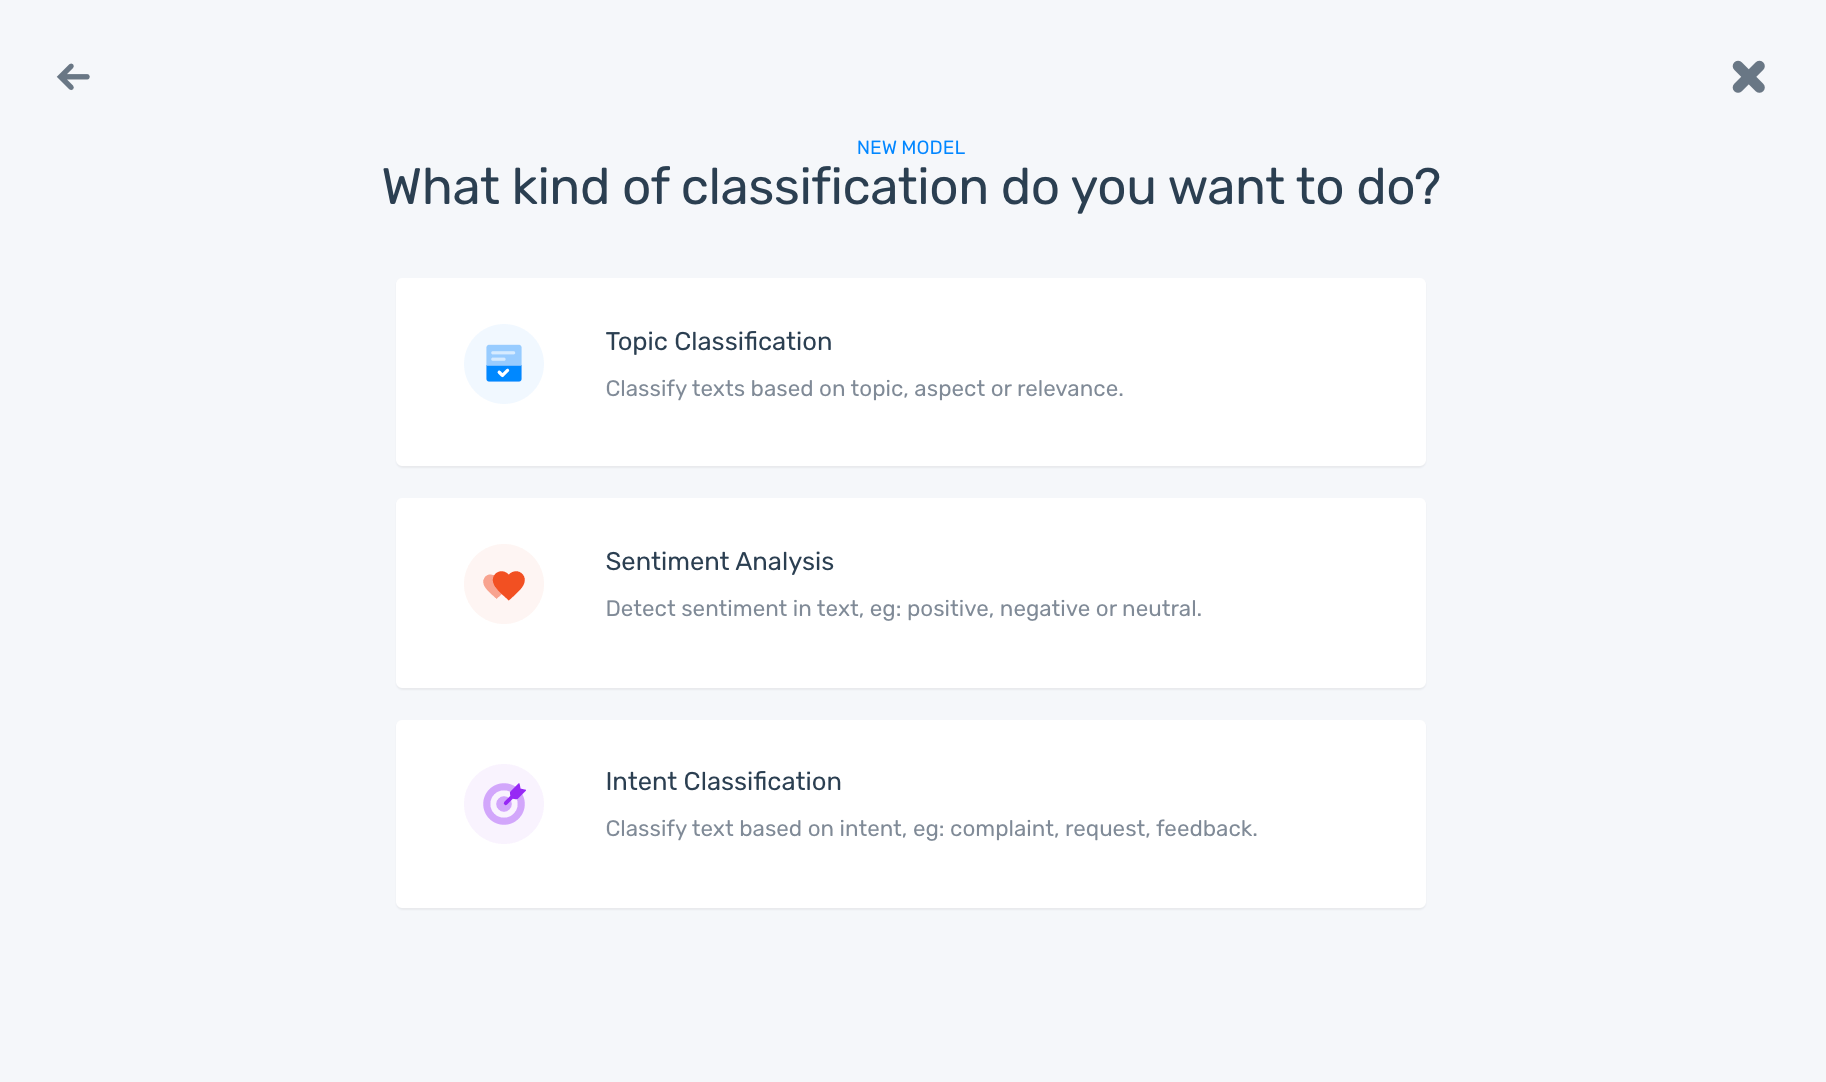
Given that we’re going to be classifying responses as positive, neutral or negative, click on ‘Classifier’. Next, click on ‘Sentiment Analysis’:
2. Import your Typeform data
This will be the information from which your model will learn. Click on CSV or Excel file depending on the format you used for gathering your responses:
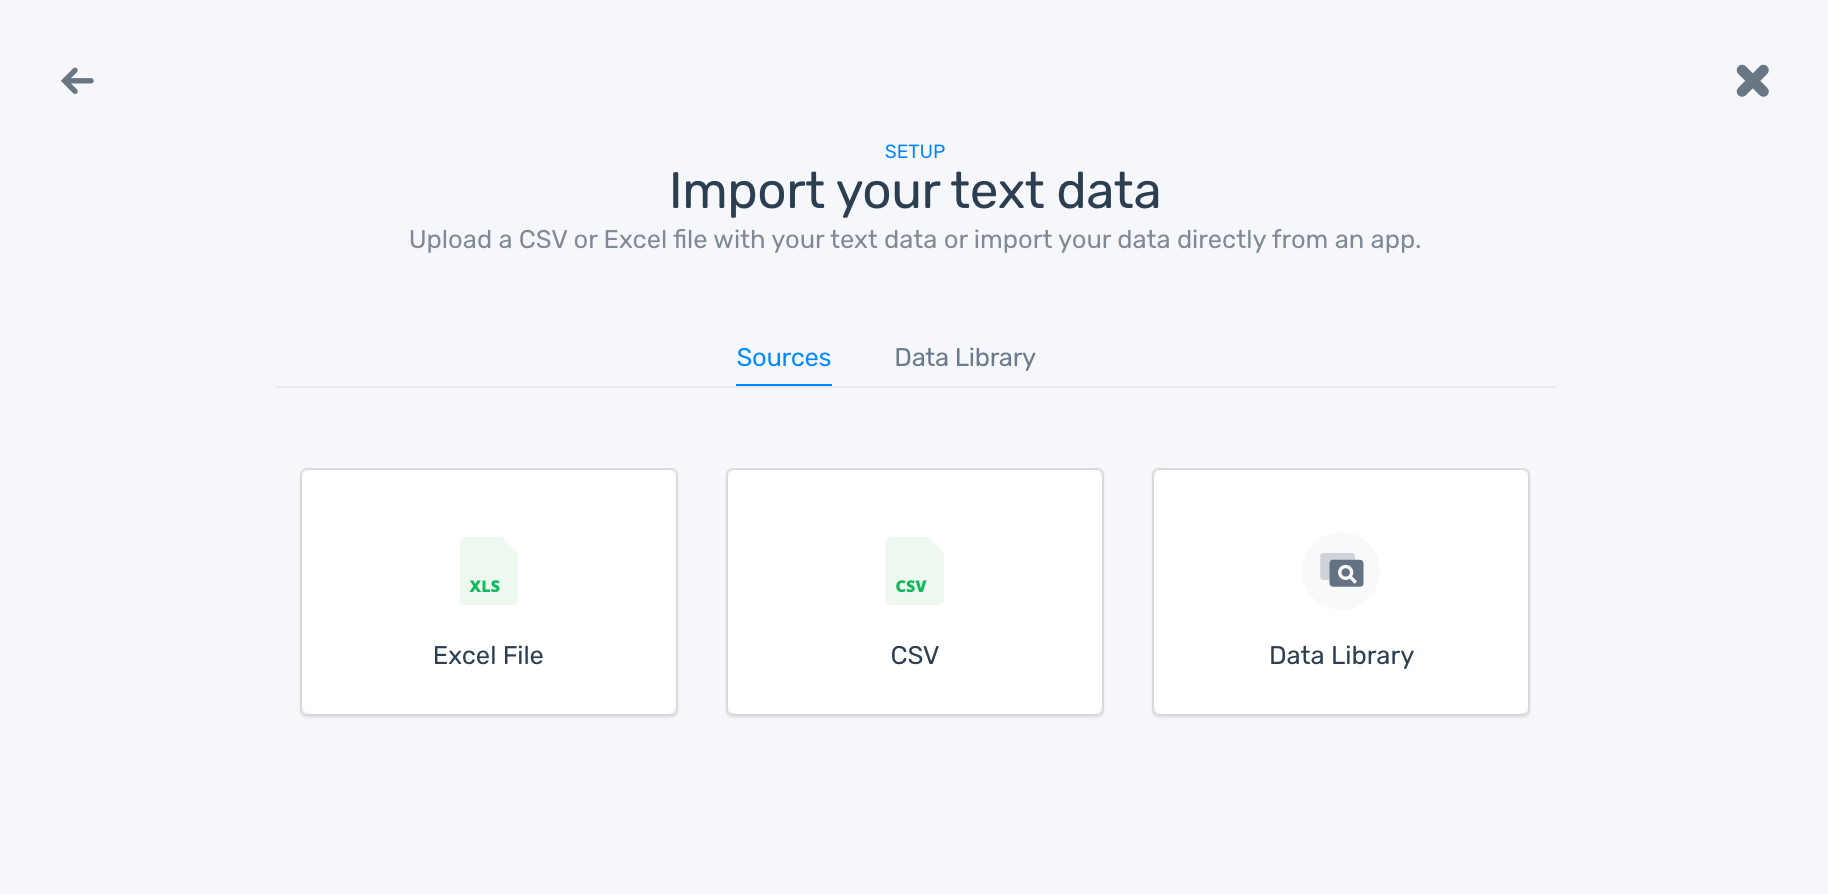
3. Start training your model
Before you start analyzing new survey responses, you’ll need to do some manual tagging to train your machine learning model. Just until your model is ready to analyze new data based on your criteria or rules. Just tag each example by clicking on positive, negative or neutral and then select ‘Continue’:
You’ll soon notice your model making predictions that you can either confirm or correct. Don’t worry if your model is still unable to accurately predict texts – this just means that it may need some further training since the golden rule is the more data you feed your model, the more accurate it will become.
4. Time to test your model
Your model has been learning for a while now, and it’s time to try it out! Go to the ‘Run’ tab and type a possible response. Does the model tag it correctly?
If tagging looks a little off, don’t worry. This may just mean you still need to train your model . Just go to ‘Build’ > ‘Train’ and tag some more samples to improve the accuracy of the model.
Also, try going to ‘Build’ > ‘Stats’. Once you’re there, you’ll be able to see the accuracy of your model and the F1 score:

You could also check the precision and recall for one specific tag, but take into account that you’ll need a minimum of four texts per tag to take a look at this. Incidentally, there’s a simple explanation of the classifier statistics here, and what you can do to improve them here.
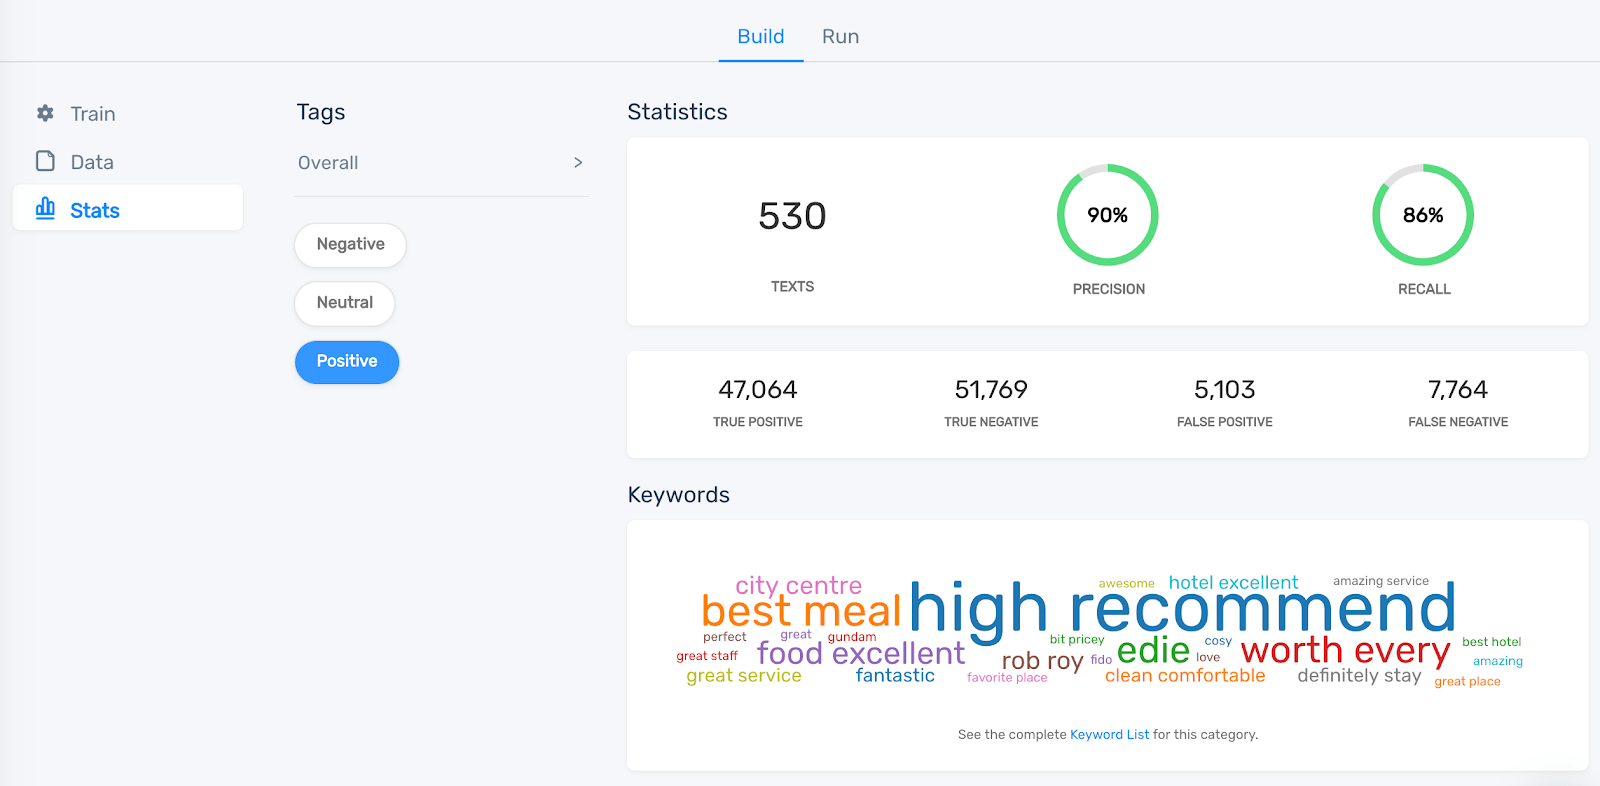
What about those keywords that appear in the screenshot? That’s a keyword cloud, and those words are the ones that appear the most in texts tagged as positive. It’s a useful tool for getting a clear picture of what customers mention in the tagged responses for each sentiment.
Now, what do you do if your model is still imprecise? Go to ‘Build’ > ’Data’ and check whether there are any incorrect tags, called false positives or false negatives. These could be to blame since wrongly tagged data could confuse your model and lead it to make incorrect predictions. If you find any mistakes, correct them to steer your model in the right direction.
5. Run your first sentiment analysis on new data
Once your model predictions are on the right track, it’s time to put your model to work and analyze new data!
First of all, you’ll need to feed your model your survey responses so it can analyze them and make predictions. There are three ways you can do this:
a. Upload a file:
The first option is to upload an Excel or CSV file with the survey responses you want to analyze. Go to ‘Run > ‘Batch’ and select ‘New Batch’:
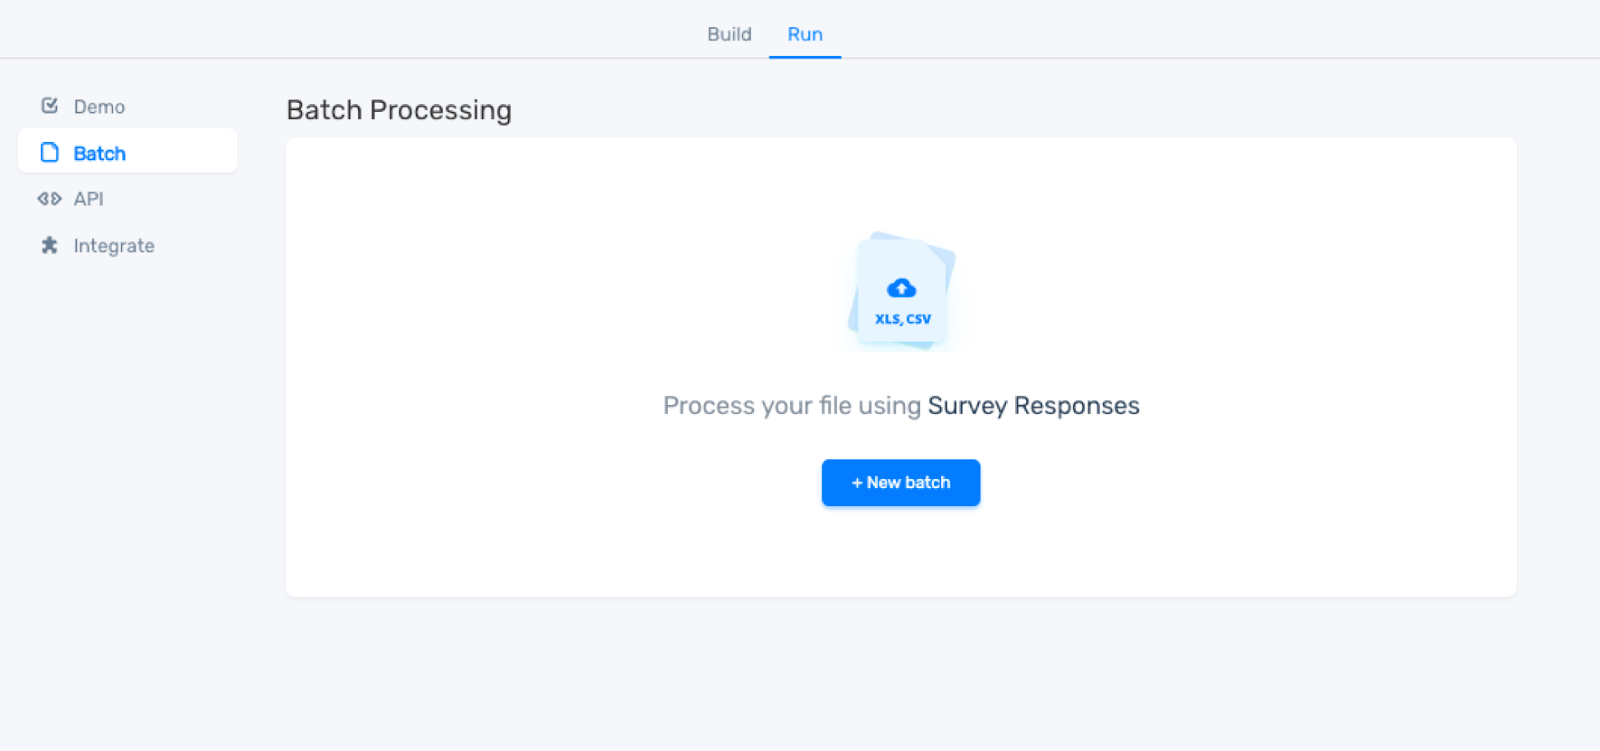
Now, click on the CSV or Excel file to upload a file to your model. In a few seconds, a similar file will download to your computer, but it will include two new columns with the predicted tag and a confidence percentage for each Typeform response.
b. Use an integration:
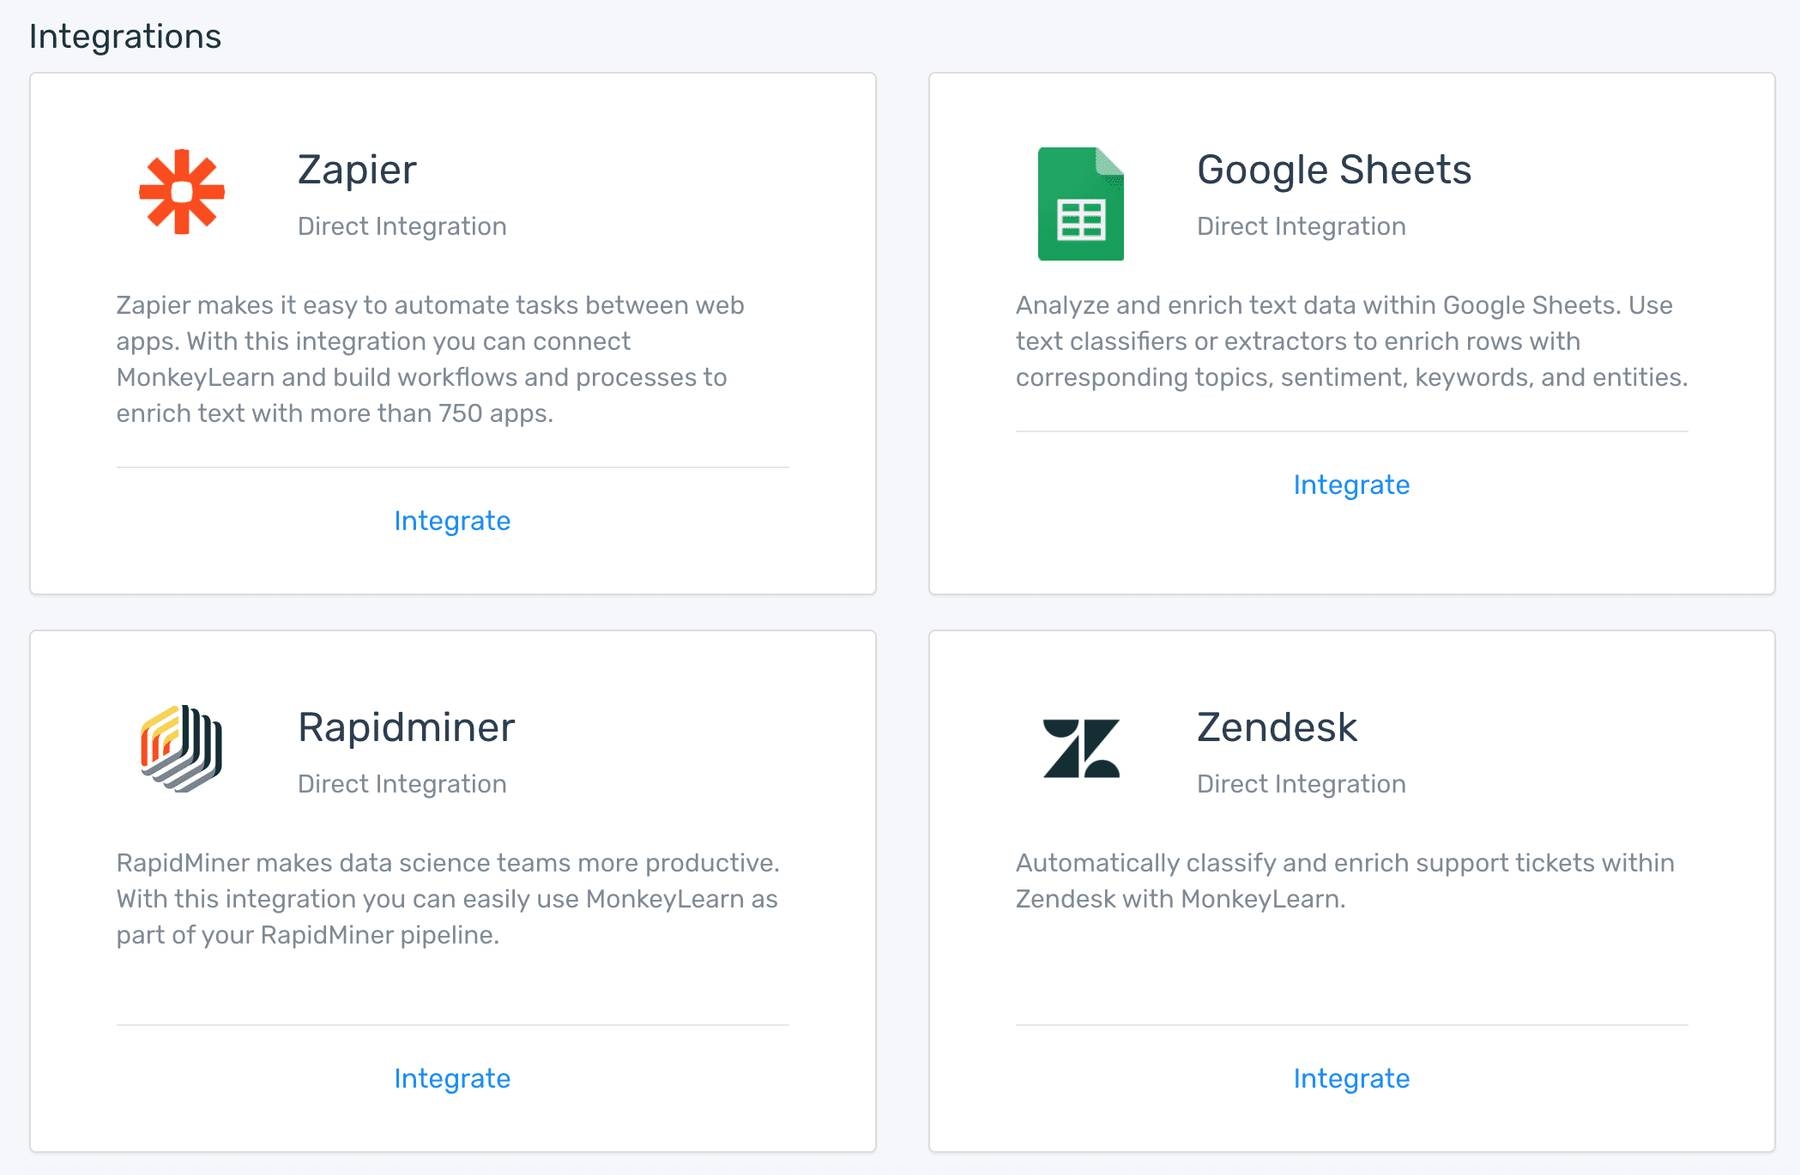
MonkeyLearn comes with some useful integrations so that you can pass data from one app to another in seconds. For example, Google Sheets is just one of the many integrations compatible with MonkeyLearn:
c. Use the API
If you know how to code, you can easily use the MonkeyLearn API to analyze new data programmatically:

Topic Classifier of Typeform Responses
You now have the tool to learn how your customers feel about your brand… but what are they talking about?
A topic classifier will answer that question. First, you’ll need to follow some steps that are similar to the ones we covered in the sentiment analysis tutorial. There are just a few differences.
First of all, after clicking on ‘Create a Model’ and picking the classifier option, you’ll have to click on ‘topic classification’.
Once you’ve uploaded the data, it’s time to create tags:
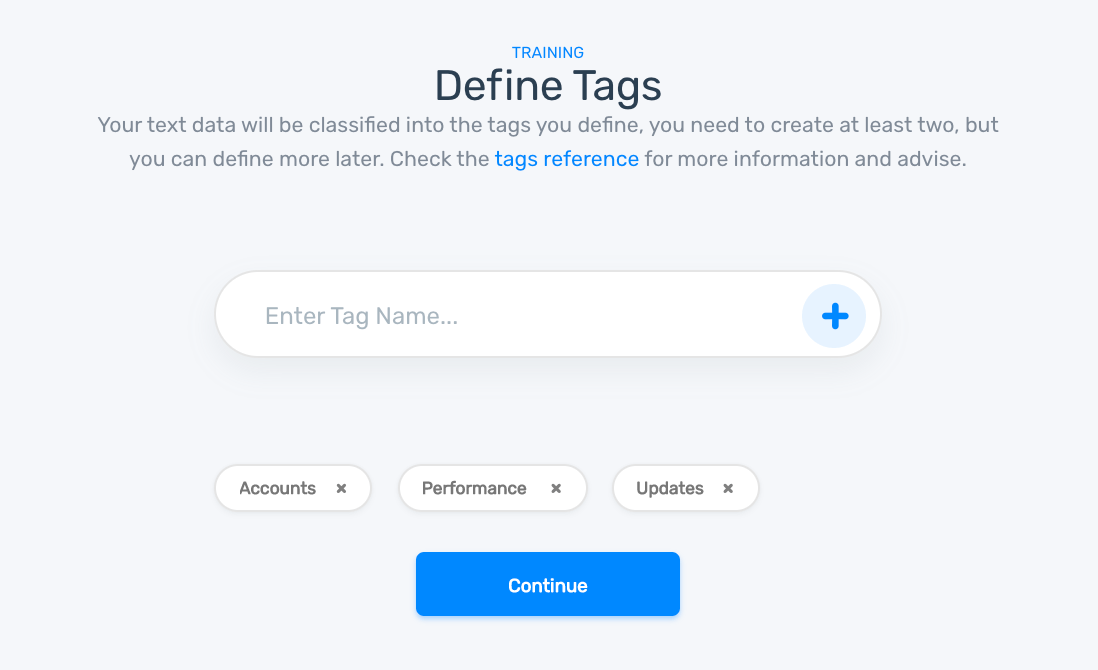
These tags should be about the different topics or themes you want to detect in your responses. In other words, the topics that are most important to your business, such as UX, Price, Reliability, Bugs etc.
You can create as many as you want, but it’s best to begin with no more than ten because your model will need enough training samples for each tag. If you create more tags, your model will need more training data.
Is your model making the right predictions? To find out, upload a new batch of survey responses and enjoy the magic of automatization! Remember that you can upload a CSV or Excel file, use one of MonkeyLearn’s integrations or the API.
Now that we’ve covered both models you may be thinking about running both forms of analysis to learn what your clients are saying about your product and how they feel about it. That can easily be done with aspect-based sentiment analysis: Just analyze your responses with the topic classifier and then upload the same file with the topic predictions to the sentiment analysis model. The result will be a spreadsheet with a column of topics and another one of sentiments.
Keyword Extraction of Typeform Responses
Let’s say that you’ve just released a new feature for your app and want to see if the negative tags are related to it… but don’t have the time to read each negative response. Then a keyword extractor may come in handy. It can tell you which words or expressions are mentioned the most in your Typeform responses, and if the name of your new feature pops up a lot under the negative tag you can address the problem right away.
One thing to keep in mind, though, is that the keywords may vary depending on your product or team. A dev team may consider Bug and UI common keywords, while a sales team may pay attention to Billing and Price.
The training steps for a custom extractor are quite simple. Just upload the training data, and manually select the keywords to train a custom keyword extractor with your criteria. Don’t worry, here you’ll find a great tutorial on how to train your keyword extractor. Moreover, there’s a pre-trained keyword extractor you can use to get started with keyword analysis right away.
Automate the Process with Zapier
You have your text analysis models ready, and you’ve already sent your Typeform surveys. Congratulations! You’ve saved yourself hours of work in a short space of time.
However… there’s something that still requires tedious and time-consuming manual labor: sending the responses to the MonkeyLearn model and then to a Google Sheet . You have to click and paste over and over again. Is there another way?
Fortunately, you can do it with the help of Zapier, a tool that helps apps communicate, and pass data back and forth by creating triggers called Zaps.
Let’s get down to business to see how to create a Zap that will have:
- A trigger → A new Typeform survey response
- An action → analyzing the response with MonkeyLearn
- An action → sending the analysis to a Google Sheet
Now, how does that come about? It’s straightforward, and it won’t take long, since Zapier has an integration for both MonkeyLearn and Typeform, and it will save you time and headaches. After following these steps, your apps will work together (aided by Zapier) to let you do your job while you get your analysis done.
Let’s take a closer look at how to set this up:
1. Log in to Zapier
If you don’t have a Zapier account, sign up for free! It only takes a couple of minutes. You should keep in mind, though, that you have 14 days of the multi-step trial version.
2. Start building your Zap
There’s a big orange ‘Make a Zap!’ button on your Dashboard. Click on it! You’ll spot it right away.
3. Define Typeform as your trigger app
Since we want a survey response to trigger the actions, Typeform will be our guy:
Then you’ll have to click on ‘Connect to Account’ to get the responses from your Typeform account and select the form you want to get analyzed.
4. Define MonkeyLearn as your action app
To the left, you’ll find an ‘Add a Step’ button. Click on it and select ‘Action/Select’. Then, you’ll have to set up MonkeyLearn as your action app and ‘Classify text’ or ‘Extract text’ as the specific action:
Follow the steps and don’t forget to ‘Connect to Account’ and paste your MonkeyLearn API.
After doing that, you’ll have to select the text analysis model you want to use and the responses you want to get analyzed:
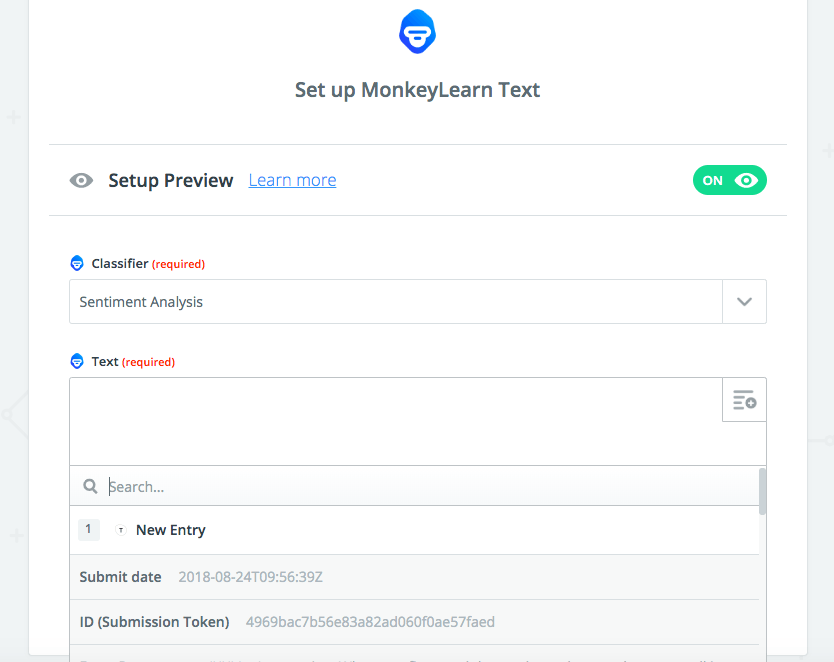
One other thing you should keep in mind is that if you’re going to run an aspect-based sentiment analysis, you’ll have to add one more action to your Zap for topic classification.
5. Connect to Google Sheets
If you want the results to automatically appear on a spreadsheet, you can add one more step to your zap. Just click on ‘Add a Step’ and pick Google Sheets as your action app. Once that’s done, select the specific action you want your Zap to perform:
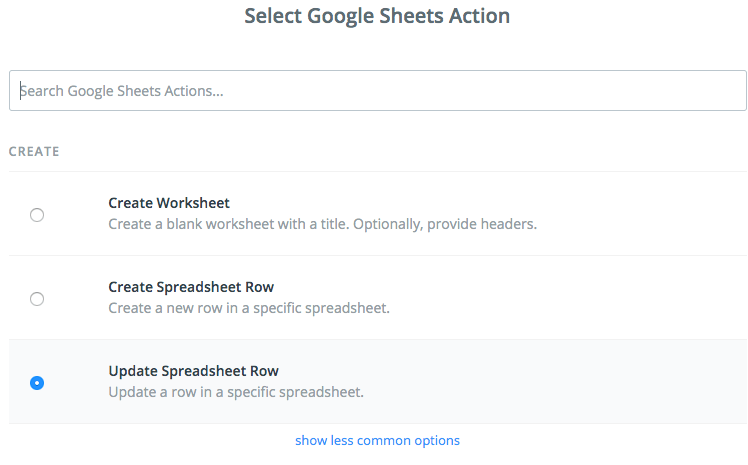
Now, all that’s left is to connect to your account and select the spreadsheet you would like to get results in.
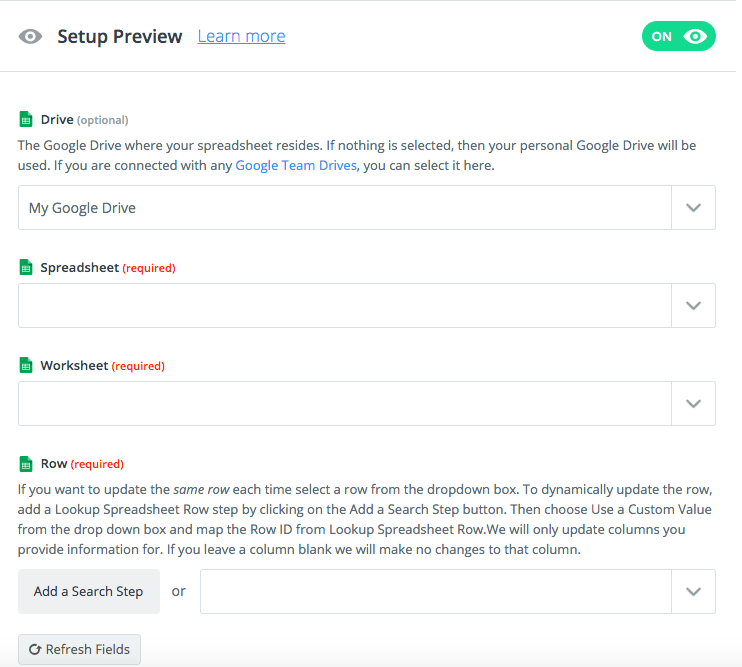
6. Turn on your Zap!
All the steps are now programmed to run automatically in the background while you make the most of your time. Just click on ‘Finish’, name your Zap and turn it on.
Done! Now you’ll receive results automatically in your spreadsheet.
Visualize the Results
A picture is worth a thousand words. This famous saying may have been uttered long before text analysis but it still holds true today. We are far more receptive to images than numbers and text. Just picture your team trying to crunch numbers and compare different topics mentioned in your survey responses. It’s painful to watch.
How can it be more dynamic? Visualization tools can help you convey deep insights in a short amount of time, and empower an informed team to take action. That’s why we’ve covered some popular data visualization tools below:.
Google Studio
Besides being intuitive, Google Data Studio can easily be integrated with Google Sheets, so if you have saved your analysis results here, getting information in a report will be easy.
Just select ‘Data Sources’ and then click on the round plus button in the bottom right-hand corner of the screen:

You’ll have to select Google Sheets from a list of data sources and then click on the spreadsheet you want to use for your report. Do you have your data in a CSV or Excel file? Then you can upload it to Google Data Storage and use the available integration to connect to your data source.
Want to get started with your report? Start by selecting a graph you’d like to use from the toolbar, then click and drop it on the canvas. Because the report has already been connected to a data source, the information will be displayed automatically. You can play around to change colors, fonts, and sizes by going to the ‘Report and theme settings’ and once everything is good to go, you can share the report with your team.
If you want to create impressive reports with Google Studio, this step-by-step is a good starting point.
Looker
There’s more than meets the eye with this tool. Looker is a fine-grained visualization tool that can help you spot trends using filters. Imagine if you want to look at your new aspect-based sentiment analysis chart and know more about sentiment analysis results for the tag Product. What do you do? Just filter by Product, and you’ll get a similar chart, but for the specific dimension you want to view.
The only bad news is that Looker doesn’t have a Google Sheets integration. There is, however, a simple script available that will help you pull data from your Google spreadsheet and push it to a database that does have an integration with Looker.
To get to know Looker in depth, you can take a look at some of their Youtube tutorials.
Tableau
Because Tableau is a visualization tool that comes with many integrations, you won’t have any problems sharing your data to create beautiful charts. And you can also upload your CSV or Excel file directly.
To create your report (they call it view), you’ll have to pick the measures and dimensions to create columns and rows. It’s not complicated, but you may need some training before you dive in. Worry not, there’s a cool crash course tutorial on Youtube that can clear up any possible confusion.
Are you hoping to find something different? There are other options in the market, such as Mode Analytics that comes with a Slack integration that could be useful for teams that use this app, and Klipfolio which allows you to connect to different data sources – complete with many templates for quick visualization.
Use Cases and Applications
You’ve invested some time putting a more cost-efficient system in place for analyzing Typeform responses automatically. You notice that your team delivers results faster, and yet they seem to be more relaxed. Well, this is down to an effective text analysis system. Let’s take a look at how else this tool can impact your team:
Prioritizing Problems by Level of Urgency
You get your newest batch of Typeform responses and — uh-oh — you notice most of them are negative. You try again with a new batch, and it’s only getting worse. How can you tackle the problem and avoid churn?
Besides fixing problems for future client interactions, one good solution could be to analyze responses by topic and level of urgency.
Having an urgency detector in place will help you spot disgruntled customers right away and, by analyzing the urgent responses with a topic classifier, you can shed some light on the problems. For instance, if most of them are related to the tag UI, you can take action right away.
Route Feedback to the Right Teams
Ok, you’ve just figured out what all the negative responses were about! Now… how do you turn unhappy customers into loyal ones? One good way to turn things around is fixing the problem straight away. But there are tons of responses… how can you do that?
Well, you could automatically route the UI urgent responses to the dev team so that they can work out what’s going wrong right away. Having first-hand access to customer responses related to a dev problem, your team will be empowered to find a solution ASAP.
Shed Light on the Voice of Customer
Why didn’t the new feature boost sales? What is it that customers like most about your brand? How can you make the most of the features they like?
With text analysis, you can gain a richer understanding of what your customers think and how they feel about your product or service. By running an aspect-based sentiment analysis, you can find out how customers feel, and why they feel that way. . Now that you have a more in-depth knowledge of the customer’s experience with your brand, you and your team can hit the mark with informed decision-making.
Wrap-up
Customer experience is fundamental in today’s market. We know this. But competitive-advantage comes down to who knows best how to please their customers. That’s why we use customer surveys and wrack our brains to find the question that will provide the answers we need to take our product to the next level.
Finding the right question may still be a challenge, but by using text analysis with your Typeform responses, the answers are now clear as water and time can be better spent on finding the solutions to provide the best customer experience possible.
You have the tool to start getting the results you need. If you’re still unsure, you can request a demo, and our team will guide you on how to get started with text analysis for Typeform.

Federico Pascual
May 29th, 2019


