How Analyzing Customer Churn Improves Your Business

Losing customers is a nightmare for any business, and finding out why customers may be leaving your company shouldn’t go ignored.
In a modern business climate where it costs five times more to acquire new customers than it does to retain the ones you already have, customer churn is an issue that’s definitely worth digging into. Because it isn’t just about retaining income from your current customer base, it’s about saving the effort and marketing dollars required to find new ones.
Performing customer churn analysis can provide insights for any company, to make data-driven decisions for increasing customer loyalty, predicting and reducing customer churn rate, even lessening the effort needed to acquire new customers.
- What Is Customer Churn Analysis?
- Different Ways in Which Customers Churn
- Why You Need to Analyze Customer Churn
- How to do Customer Churn Analysis
What Is Customer Churn Analysis?
Customer churn (also known as customer attrition rate) is the loss of a company’s customers or clients. Analyzing customer churn can help a business identify customer pain points that lead to churn, and put new systems and processes in place to improve retention.
The goal is to minimize churn by understanding how your customers use your product or service and why they may be unsatisfied.
Customer and revenue churn come in many forms – from canceling subscriptions to streaming services, to switching credit card providers, to changing one's preferred breakfast cereal. Understanding the circumstances of customer churn is the first step in learning how to lessen it.
Different Ways in Which Customers Churn
For SaaS businesses, customer churn is usually due to one or more of these three factors:
Subscription cancelation
Marketing your product or service to the wrong type of customer often results in immediate churn, when they find out the product isn’t quite right for them, meaning you’ve wasted all the time and money it took to attract them.
Or if functionalities aren’t up to your customers’ needs, they may decide to cancel services. For example, as a product or service’s occupational landscape changes, customers may request new features. And if their demands aren’t met, SaaS products may become irrelevant to their needs.
Sometimes, something as avoidable as a poorly executed onboarding can lead to customer churn. The product may actually have everything the user needs, they just haven’t been shown how to use it to its full potential.
Leaving for the competition
This can be due to functionalities, if your competitors are more in tune with the changing needs of the customer base. Your competition may, however, simply be better at marketing their products or better at listening to their customers.
Implementing a customer feedback loop to regularly analyze customer feedback can ensure that you remain competitive in the marketplace. Furthermore, performing competitive analysis will help you learn what the competition may be doing better than you and can inform new features and improve marketing.
Non-renewal of subscriptions or services
Sometimes a customer may have run through the lifecycle of a product or service, so new added value is needed to keep them on board.
Oftentimes, however, poor communication between a company’s internal departments or unsuccessful customer account management can lead to the loss of perfectly satisfied customers. This can often be avoided by regularly requesting customer feedback. For example, sending customer satisfaction surveys can ensure regular customer engagement, and let your customers know that you’re listening.
Delinquent churn can also be a culprit here, when a customer forgets to update their account or add new credit card info, for example.
Why You Need to Analyze Customer Churn
Digging into your churn data to find out why customers are leaving can offer huge benefits for any company. Even a slight increase in customer churn can cause major problems, so real-time customer churn analysis is important to find out why customers are leaving at the rate they are and enables businesses to fix the problem as soon as possible.
Proof in numbers: Why is customer churn analysis important?
- Just a 5% increase in customer retention can increase profits by 25-95%
- It’s 5 times more expensive to acquire new customers than retain the ones you already have
- It’s 16 times more expensive to bring a new customer up to the level of an existing customer
- The likelihood that businesses can sell to existing customers is 60 to 70%, while they’re only 5 to 20% likely to attract a new prospect
- According to a recent PWC survey, 32% of consumers worldwide say they would leave a brand after just one bad experience, and 54% of American consumers say customer experience at most companies needs improvement
- US businesses lose $136.8 billion a year to completely avoidable customer churn
It’s clear that decreasing customer churn is one of the keys to keeping your business relevant and successful in the marketplace. Read on to find out how to collect customer churn data and analyze it for immediately actionable insights.
How to Analyze Customer Churn
Monitoring Key performance indicators (KPIs) can help you detect why customers are churning.
For example, decreasing levels of customer engagement and usage might indicate customers are losing interest with your product or service, or a rise in support tickets might suggest that customers are increasingly dissatisfied. While these performance indicators provide a birds eye view of issues leading to customer churn, they don’t provide a detailed analysis.
With MonkeyLearn’s AI technology, you can dig deep into your unstructured data (like open-ended survey responses, online reviews, and social media conversations) to identify the reasons for customer churn and even detect customers that are likely to churn.
Follow this step-by-step guide to performing churn analysis with MonkeyLearn:
1. Get your customer churn data
Find out why your customers are leaving with targeted customer surveys at time of cancelation (or other customer journey touchpoints, like after purchase or after onboarding).
You can design them to pop up on your website, in-app, or in-chat, or send them in emails. Survey tools, like SurveyMonkey and Typeform make creating and sending surveys simple with ready-made templates and easy-to-design custom surveys, and integrations with MonkeyLearn make data extraction and analysis painless.
Other MonkeyLearn integrations with CRM platforms, like Zendesk, Freshdesk, Service Cloud, and HelpScout allow you to extract customer support data to pinpoint risk customers, follow the long term customer lifetime, and find out why customers may be dropping off. You can even analyze sentiment on social media platforms to find out how customers are talking about your brand on Twitter, Facebook, Instagram, and more.
2. Segment customers by cohort
“Cohort” refers to factors or experiences you can use to divide your customers into distinct sections. For our customer analysis, we divided churned customers by how they use the service and what they use it for.
There are a number of useful theories on the best way to divide your customers into cohorts, allowing you to target clear cross-sections. Some will be obvious – by product or product feature. But some may be harder to pin down, like marketing cohorts that segment customers by multiple factors, like location, age, income, etc. The main thing to keep in mind is that each cohort is distinct from the next.
Below shows a breakdown of our cohorts in Google Data Studio (more on that later). The first segmentation is by the type of plan customers use:
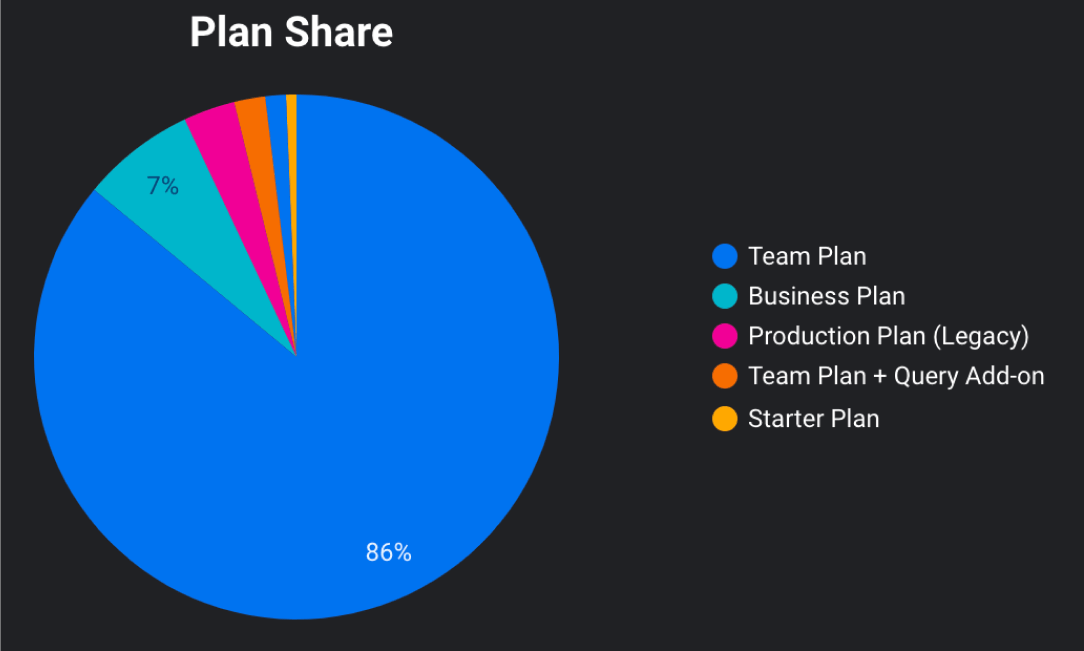
Then churned customers were segmented by Use Cases: What do they use the product for...? Analyzing customer feedback, for a particular product feature, conducting and analyzing surveys, etc.

3. Analyze customer churn by cohort
Here’s where machine learning comes in! Follow along to make a custom topic analysis model with MonkeyLearn to analyze customer churn by cohort.
Topic analysis is used to automatically separate your customer churn data into topics, subjects, or aspects, like RUF: Reliability, Functionality, Usability. This will allow you to understand which aspects of your business, products, or services have the most customer churn in each cohort and what the problems are by topic.
But first, we need to separate our comments or survey data into “opinion units.” Oftentimes a single survey response or customer comment may contain multiple statements or opinions, so we need to separate them into individual opinions, to get a thorough analysis.
Once your MonkeyLearn analysis is set up, you’ll be able to separate thousands of survey responses into opinion units automatically, but try out the opinion unit extractor below with your own text to see how it works:
Customer churn topic analysis: machine learning tutorial
1. Choose a model
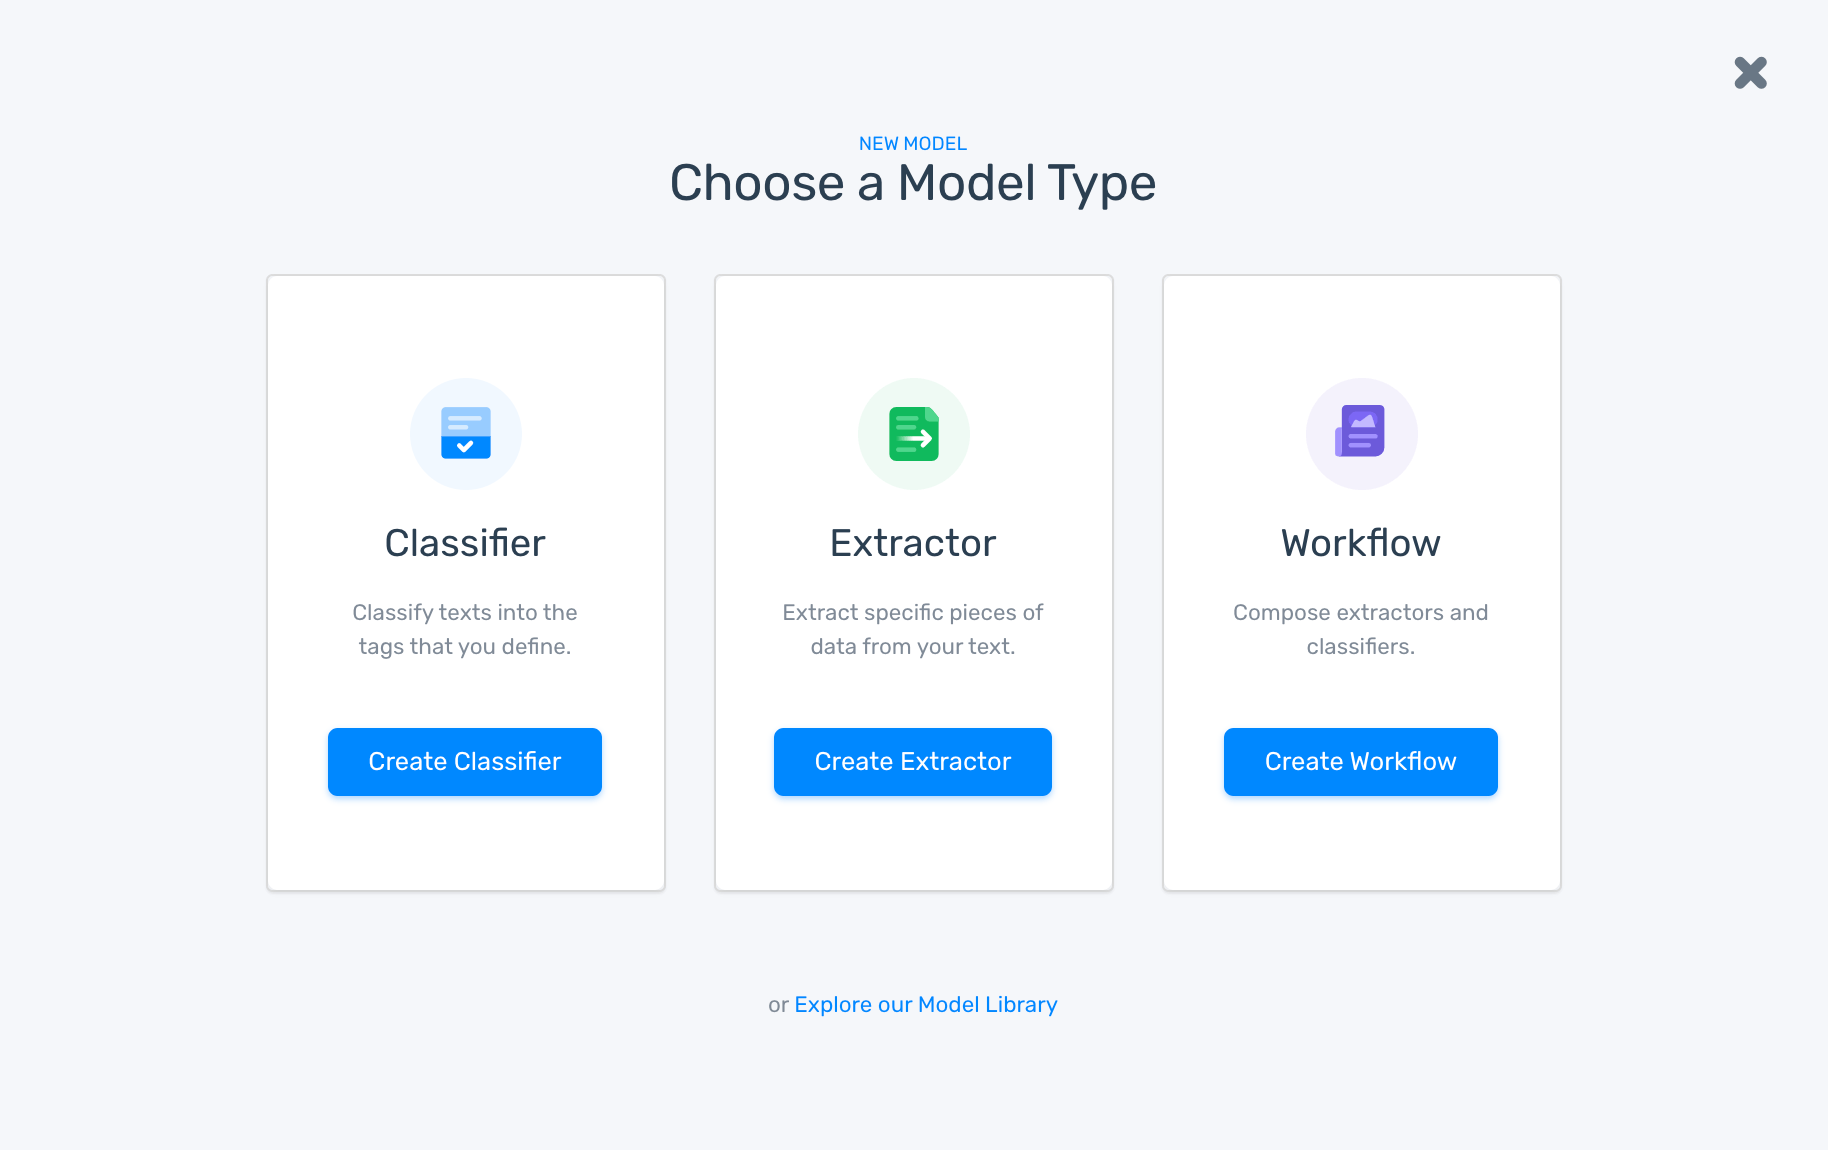
If you haven’t already, sign up for a free MonkeyLearn account – it just takes a few seconds. Go to the MonkeyLearn dashboard, click ‘Create Model,’ and choose ‘Classifier’:
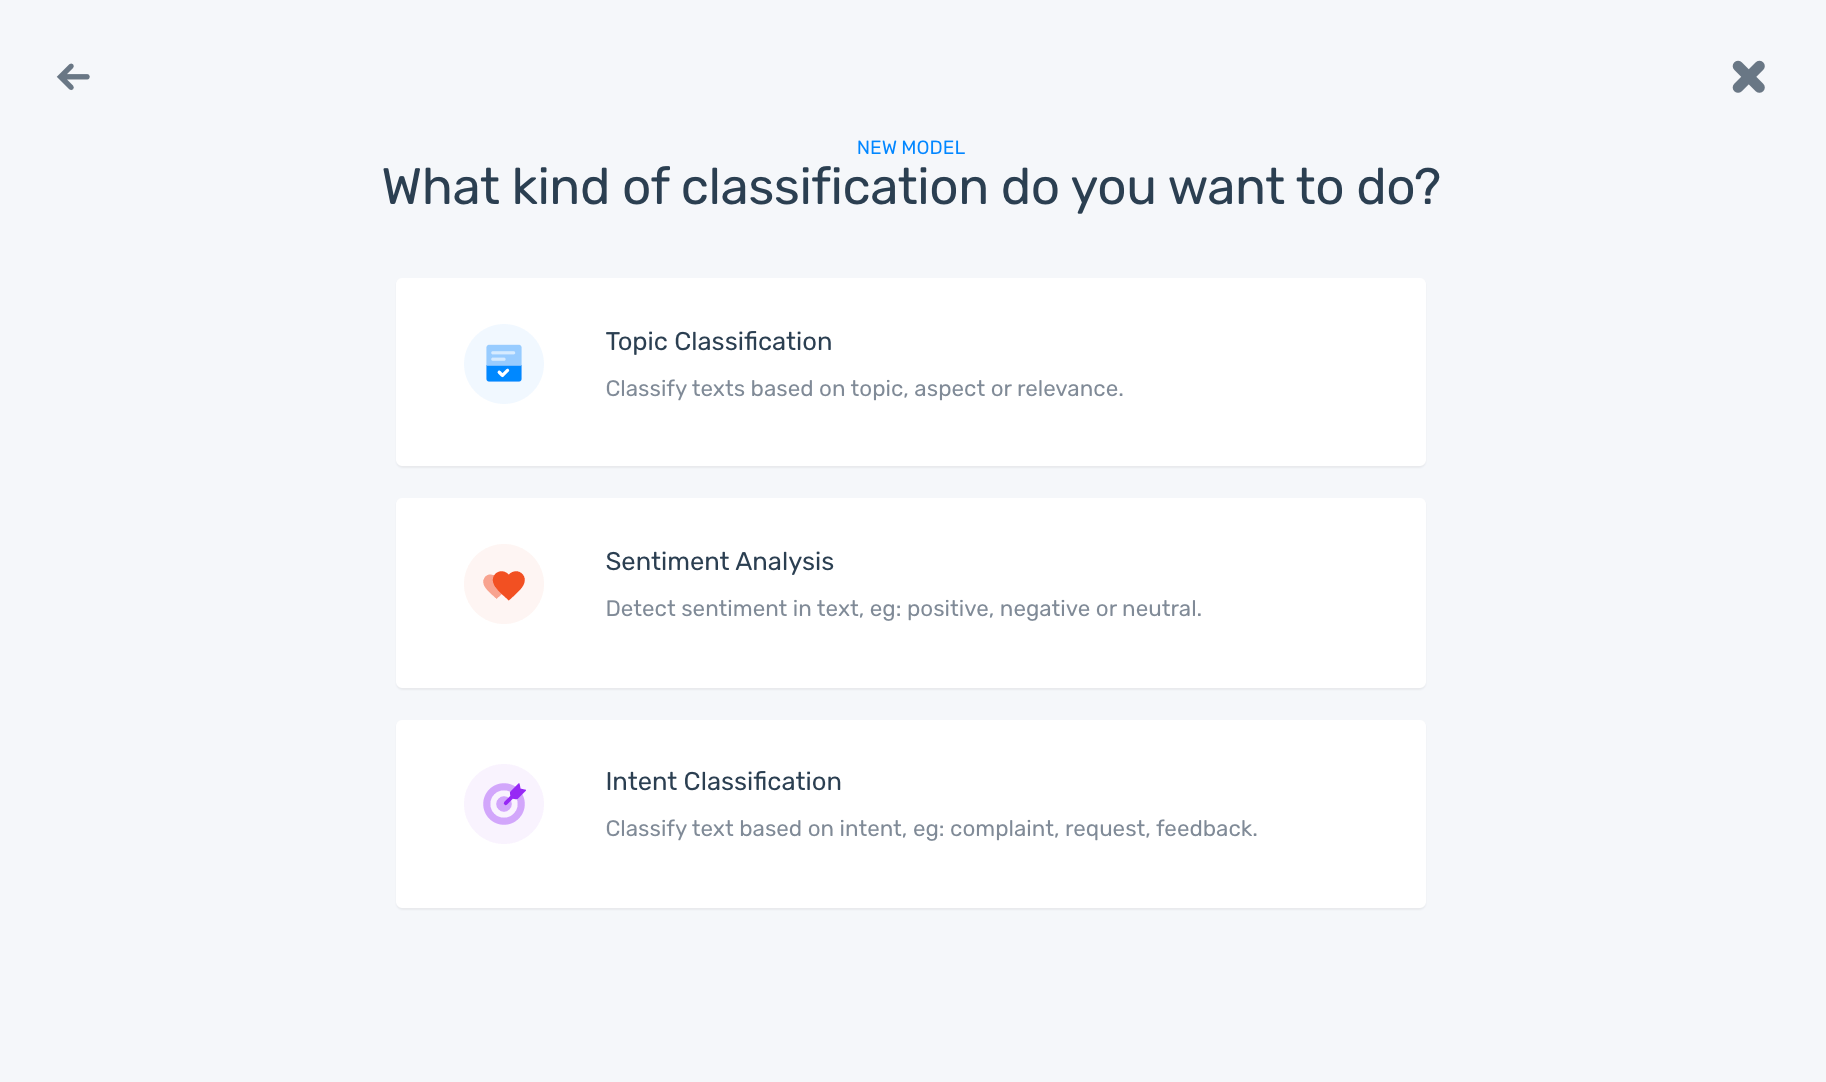
Choose ‘Topic Classification’:
2. Import your customer churn data
You can upload a CSV or Excel file, or if you don’t have a dataset, download one from the Data Library.
We’re using focusing on customer churn data from our Customer Feedback Use Case cohort, that’s been split into opinion units.
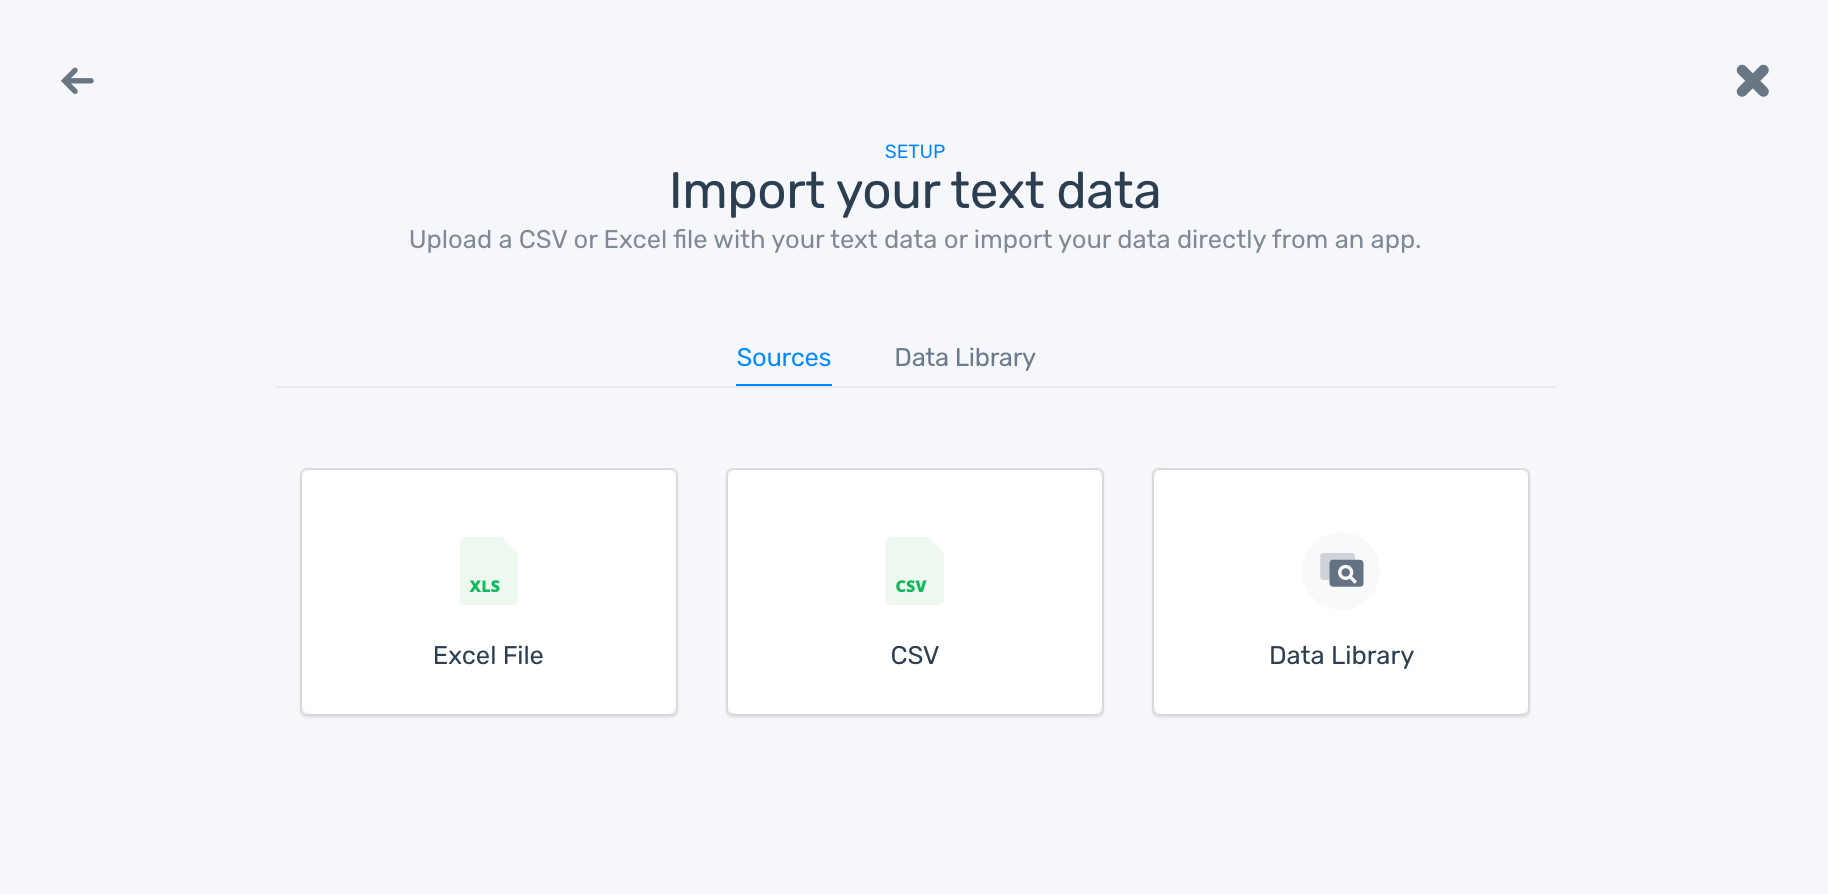
If there’s more than one column, select the one you need, and click ‘Continue.’

3. Define your tags
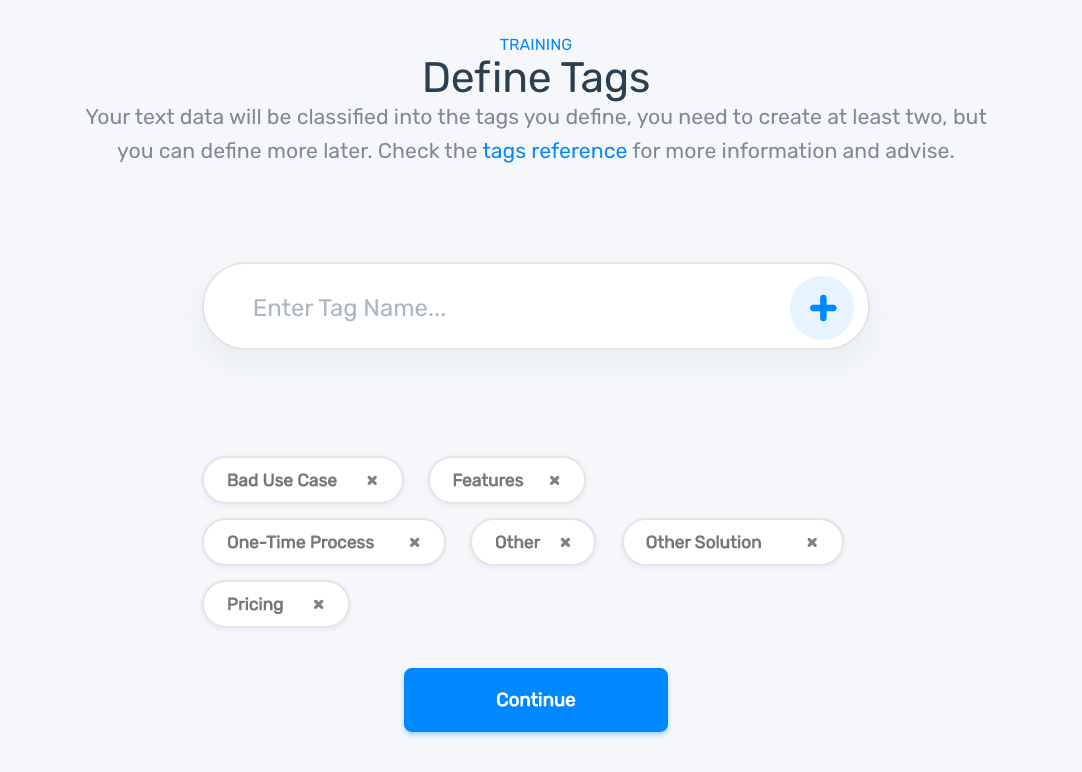
Select the topic “tags” that are appropriate for your data. They should be divided into distinct topics that don’t overlap, and it’s generally advisable to start with ten or fewer, so it isn’t too difficult to decide where they belong. For our analysis, we’re using the tags: Pricing, One-Time Process, Other Solution, Bad Use Case, Features, and Other.
4. Start tagging your responses
Tag each opinion unit according to your criteria:
You can trash or skip irrelevant data, and if you tag incorrectly, click ‘Back’ to fix it.
Once you’ve tagged a few, the machine learning has begun and the model will begin to make predictionst. If it tags incorrectly, correct the tag.
5. Test your customer churn analysis model
Once you’ve tagged a number of tickets, you’ll be prompted to name your model. Then it’s time to test it! Enter your own text to see how it performs:
If the model isn’t performing to your standards and criteria, click ‘Build’ and keep training. The more you train your model, the better it will perform.
In the ‘Build’ menu, you can also check ‘Stats’ to see how your model is performing. Check overall statistics or by individual tag. Below shows stats for “Bad Use Case”:

In the bottom right, you’ll see a keyword cloud, showing the most used and most important words and phrases for the topic, Bad Use Case.
6. Put your customer churn model to work
Once your model is performing accurately, it’s time to put machine learning to work on all of your customer churn data. Click ‘Run’ and where you can:
- Batch process new datasets with thousands of responses by importing an Excel or CSV file
- Integrate with CRM or survey tools, like Zendesk, SurveyMonkey, and more
- Use the MonkeyLearn API to automate even more analytics
4. Visualize your customer churn results
Data visualizations with striking charts and graphs make it easy to understand your data as a whole or dig into it by cohort, reason for leaving, follow churn over time, and more.
We ran our results through the business intelligence (BI) visualization program, Google Data Studio. Take a look.
Here we have the share of each use cases and the distribution of responses:

Next, we can show the overall reasons for churn with a percentage breakdown and number of customer responses:

Now, we can get even more fine-grained, to show customer churn by our pre-determined cohorts, with a topic analysis breakdown to show why each customer left by topic percentage.

You can see the overall Use Case breakdown and scroll over each cohort to see the data breakdown:

Even follow customer churn as it changes over time to pinpoint what might have happened at a certain date or why it may continue to rise:

5. Take action!
Use your information to prevent future churn.
Visualizing your data can make it easy to get a point across to employees, board members, executives, and investors. You can take a quick scroll through charts and graphs to show in broad detail or identify individual problematic cohorts, topics, dates, etc.
Use your data to improve processes, like customer service, or create new features that your product may be lacking. When you pinpoint problems, it’s much easier to come up with data-driven solutions. And, when you’re all done, be sure to close the customer feedback loop and let your customers know you’re listening – that you’ve instituted changes or will right the wrongs.
Wrap Up
Performing real-time customer churn analysis is probably your best course of action you can take to find out why customers are leaving and implement immediately actionable insights. You may find some serious technical issues or other problems that need to be fixed, but sometimes, just letting your customers know you’re listening can be surprisingly successful to improve customer retention.
MonkeyLearn’s suite of powerful text analysis tools offer a low-to-no-code solution for customer churn analysis that you can start using right away. From there you can add even more analyses, like keyword extraction – to automatically extract the most used and most important words and phrases – or sentiment analysis, to automatically read your survey results and comments for polarity of opinion (positive, neutral, negative, etc.).
And with BI visualization tools, like Google Data Studio or MonkeyLearn Studio, your results will be much easier to understand and offer a much more convincing argument to employees and stakeholders.
Sign up to MonkeyLearn to try out our tools for free; take a look at MonkeyLearn’s pricing page to see our plans and options, or schedule a demo, and we’ll show you in detail how to get the most from your customer churn data.

Rachel Wolff
December 3rd, 2020


