What Is Customer Effort Score & How Can You Improve It?

We all have busy lives, and no one wants to spend their time dealing with companies, products, and services that require effort and hard work.
In today’s competitive landscape, your customers can easily switch to another company if doing business with you is too difficult. This is why knowing your customer effort score (CES) is essential.
The customer effort score is a customer satisfaction metric that shows a customer’s level of effort while interacting with your company. It’s a quick pulse check on how easy it is for customers to resolve their issues or use your products and services. It’s also a good indicator of future loyalty.
It’s in everyone’s interest to make sure customers' needs are met promptly, and customer effort score surveys tell you when this is not happening, so you can take action.
Keep reading to learn more about CES, how it compares to other customer satisfaction metrics, the pros and cons, and how to improve your customer effort score.
If there’s a section you want to read first, just jump ahead here:
- What Is The Customer Effort Score (CES)?
- CES vs NPS vs CSAT: Comparing Customer Experience Metrics
- CES Pros and Cons
- How to Improve CES
What Is the Customer Effort Score (CES)?
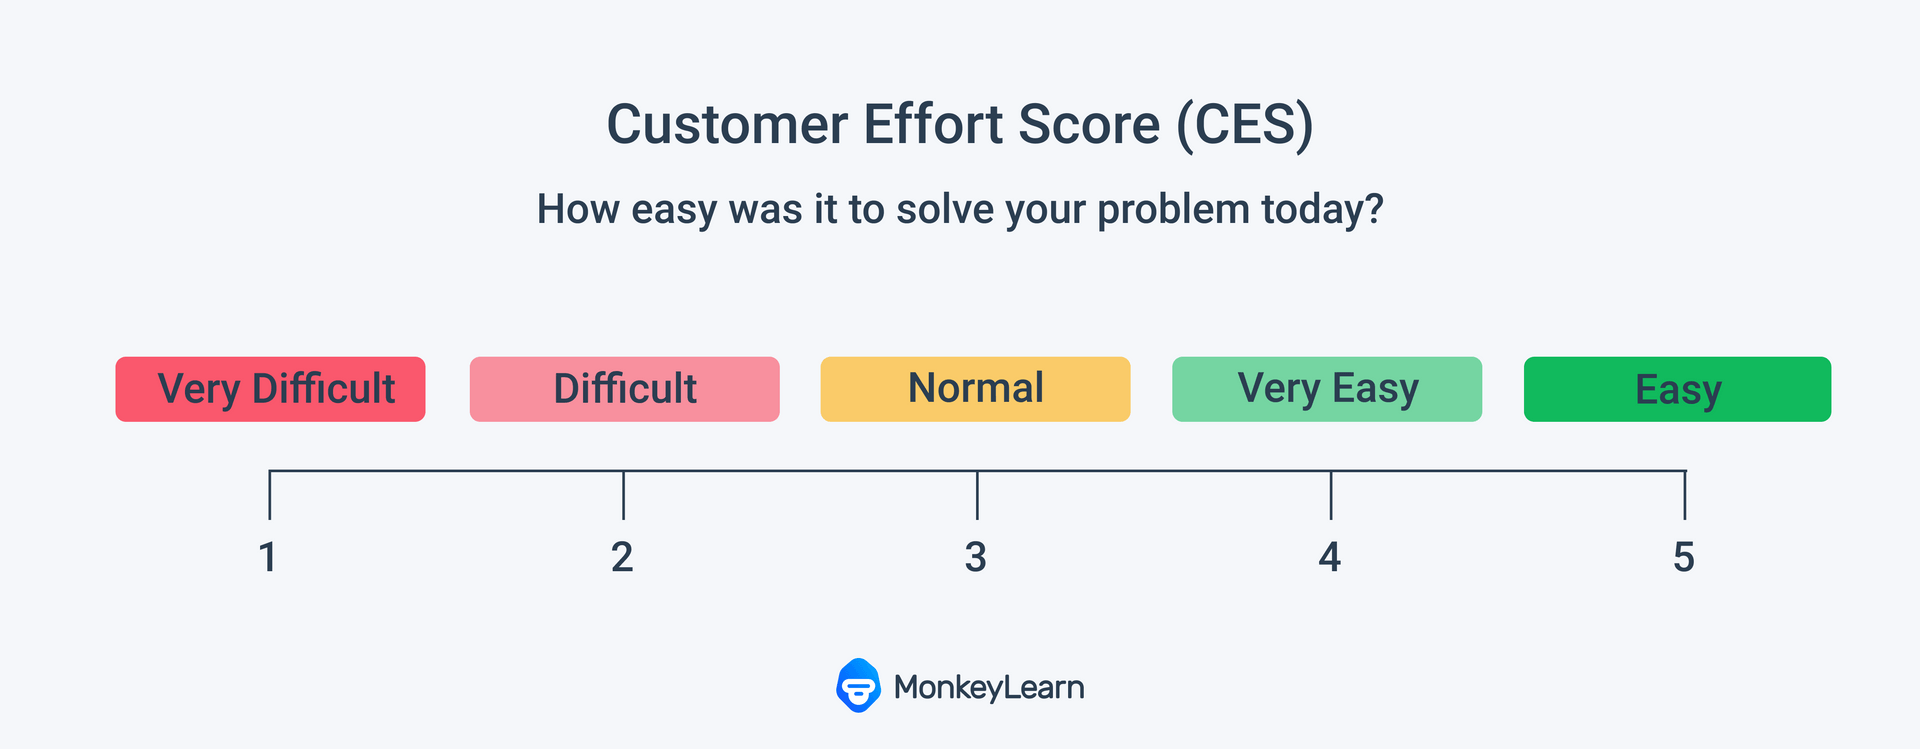
A customer effort score (CES) is a customer satisfaction metric that tells organizations how easy or difficult customers find it to do business with them. A CES survey asks customers to rate the amount of effort needed to use their products and services on a scale of “very difficult” to “very easy”.

The CES was developed in 2010 after CEB Global (now Gartner) found that customers who had high-effort interactions with brands often went on to be the least loyal.
What is a high-effort interaction? Having to call several times to have an issue solved, being provided with conflicting answers by different customer service agents, not knowing why your product is delayed…the list goes on.
How hard customers feel they have to work when interacting with companies matters a lot.
The landmark CEB study showed that 96% of customers who had high-effort experiences reported being disloyal, whereas only 9% of customers with a low-effort experience reported the same.
Effortless customer experiences were found to be one of the biggest drivers of customer satisfaction and therefore loyalty, more so than feel-good customer service measures.
The same study showed that the loyalty resulting from a company just meeting customer expectations was the same as that which resulted from exceeding them. Seeing as it costs a lot more to exceed expectations, reducing customer effort can save you money too.
How Does Customer Effort Score Work?
Customers simply fill out a quick survey at the end of a specific touchpoint with a company. In this survey, they indicate whether they felt their experience was very easy, easy, normal, difficult, or very difficult concerning effort.
This could be at the end of a purchase, the end of a customer service call, or any important touchpoint along the customer journey.
While CES surveys are often quantitative, you can also include qualitative or open-ended questions with a freeform section for the customer to explain exactly what they liked and/or didn’t like. These answers often provide you with the most useful and actionable insights.
Regardless of which type of data you collect, it’s best to always keep CES surveys short and to the point.
Calculating your Customer Effort Score
A CES is constantly updated and re-calculated as more customers respond to your survey. You calculate your score by adding the total of the responses and dividing that by the number of responses received.

Here’s an example:
If a customer is rating their experience on a scale of 0-5, 0 being the poorest rating and 5 the best, like this:

And the following 6 scores are received: 3, 4, 4, 5, 2, 3, your calculation and score would be as follows:
If your survey uses a Likert Scale, then you label each answer with a number and take the average.
Finally, for emojis, calculate the percentage of both happy and sad faces out of the total number of respondents to see how your score looks.
What Is a Good Customer Effort Score?
There is no one universally accepted number that shows a good customer score, as there is no standardized scale or number.
However, you can draw positive conclusions about the customer experience if the number stays around the higher end of the scale. When the number is at the lower-end, you need to pay closer attention to how you can improve your customer service experience.
Instead of comparing your effort scores to those of other organizations, it makes sense to compare your current score with what it was 6 months or a year ago. This will show you if your customers' experiences are getting easier, or more difficult.
Why You Should Measure Customer Effort Score
Research shows that reduced customer effort levels and customer retention are inextricably linked.
You need to continually measure your CES because it is dynamic and always changing. If you consistently track the changes to the score over time, it becomes easier to pinpoint issues and tackle them quickly when a dip in your score appears.
Plus, by resolving these issues quickly and reducing the number of times customers have to speak with customer service, you keep costs down.
Measuring your CES can also protect future business. When people have a bad experience with a company they talk about it with their friends. You want to be reducing labor-intensive experiences to lessen negative chatter that could put off potential customers.
When You Should Use Customer Effort Score
Timing is key with CES. To get the most responses it’s important to follow up quickly post-interaction. If the experience is fresh in the customers’ minds, they are more likely to answer and provide a score that accurately correlates with how they felt the interaction went.
These three instances are particularly good times to send a CES survey:
1. After a purchase
Here you can get great instant feedback on the ease of your buying process. You’ll see instantly where things could be improved.
2. After a customer service interaction
This allows you to measure the effectiveness of your customer service team and learn if there is room for improvement or training.
3. After a delivery
Taking the survey after this touchpoint will give you a general idea of how easy it was for your customer to receive your product or service.
CES vs NPS vs CSAT: Comparing Customer Satisfaction Metrics
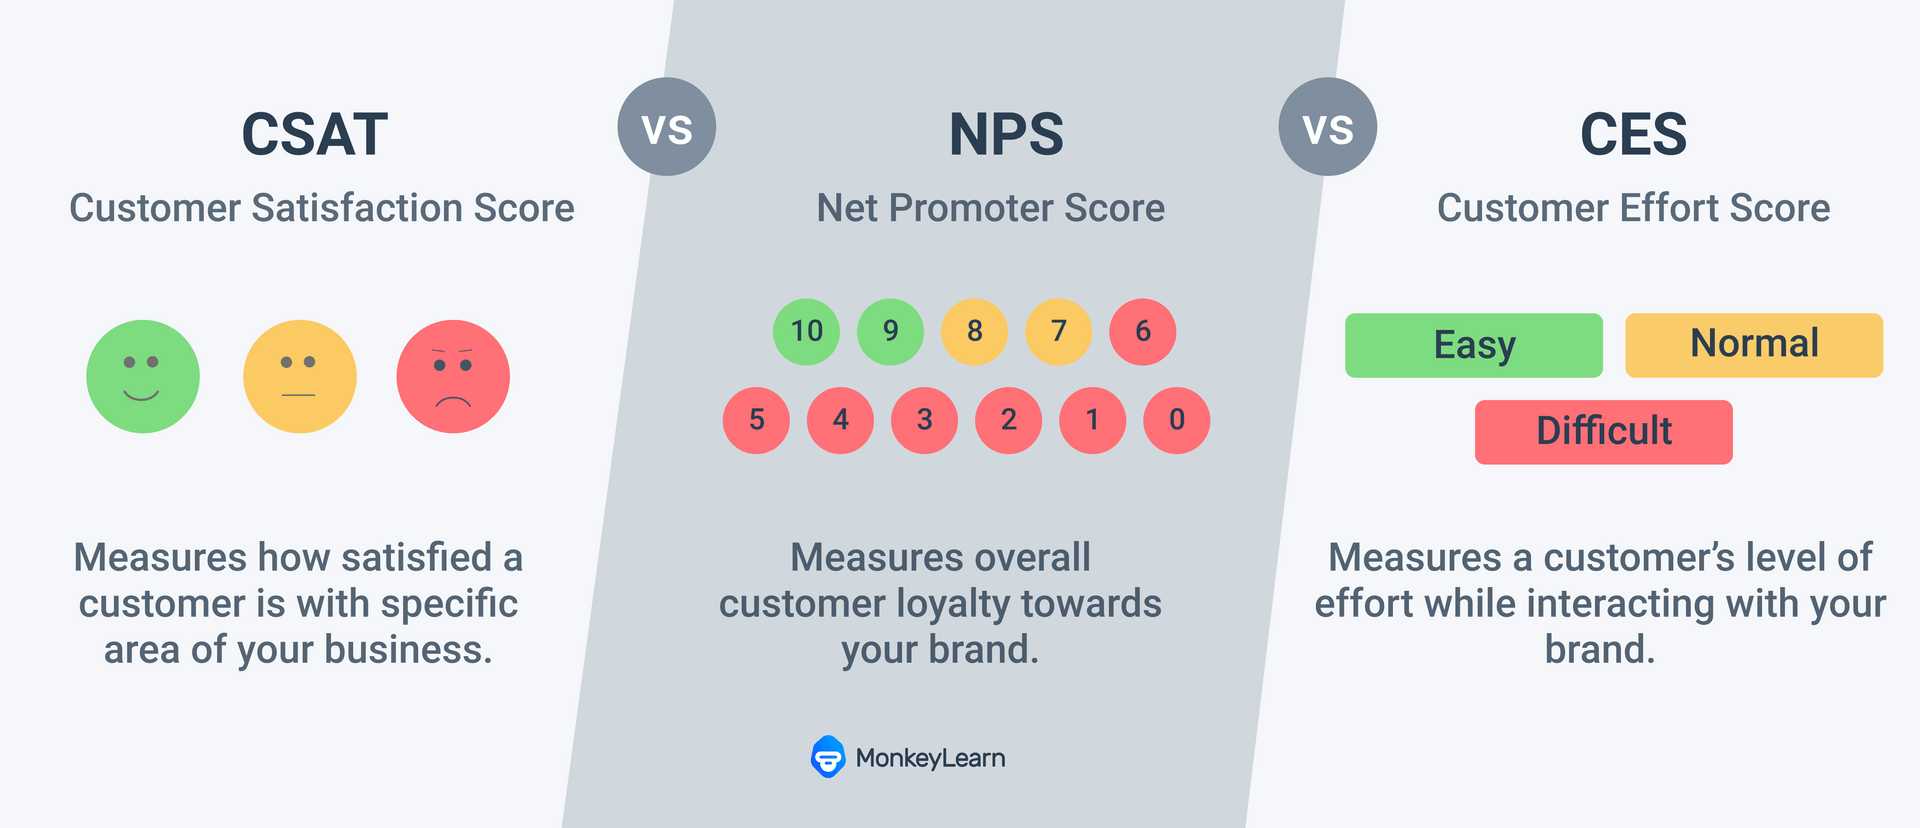
CES is not the only metric out there when it comes to measuring customer satisfaction. The Net Promoter Score (NPS) and Customer Satisfaction Score (CSAT) are the other two big players, and often work well alongside CES.
Let’s run through these two to see how they stack up against the Customer Effort Score:
An NPS is taken from a simple one-question survey and measures how likely your customer would be to recommend your brand/organization/products/services to a friend or colleague.
The customer is asked that same question and must choose on a scale of 0-10. Those who choose a number between 0-6 are labeled as Detractors, 7 and 8 as Passives, and 9 and 10 as Promoters.
NPS focuses on the customer's satisfaction with the brand as a whole, whereas CES tends to focus on one specific moment in the process. This is a big difference between the two.
CES and NPS are also different in that the former focuses on what level of effort they had to make to carry out their transaction, whereas the latter focuses on general satisfaction with the organization.
Finally, a big difference between these two is when the surveys are deployed. CES is used at the end of specific touchpoints or interactions along the way. Whereas NPS is used at the end of the customer's journey or during neutral touchpoints that do not trigger the customer's feelings about their last important interaction.
Then you have CSAT, which is a short survey measuring customer sentiment after a specific touchpoint. The customer is asked how satisfied they are with a recent experience on a scale of 1 to 5, with 1 being very unsatisfied and 5 being very satisfied.
Like CES and unlike NPS, the CSAT is focused on a precise moment in the customer's journey. It’s also similar in that it’s generally a closed-ended question but open-ended questions can be added to the customer satisfaction survey.
Where it differs is, again, in the intent behind the question. It focuses on how happy or satisfied the customer is following the transaction, rather than how hard or easy it was to get the result they wanted.

Customer Effort Score (CES) Pros & Cons
Customer effort score has a lot of strengths, but it has its limitations too. Knowing these from the get-go allows you to plan your customer loyalty metrics strategy carefully. You can then be prepared with tools to further maximise your findings.
We’ll start with the pros.
Pros
- Effort level on the part of the customer is one of the biggest indicators of intent to repurchase. Customers want an easy experience. One of CES’s biggest selling points is that it tells you quickly when they’re finding the process easy and when they’re not.
- It’s specific, therefore it’s easy to go in and fix what is not working. The customer effort score tells us about one touchpoint within the customer experience. This removes a lot of the guesswork when trying to identify and improve customer’s pain points.
- The survey tends to be short, it’s easy for the customer to complete so they are more likely to do so.
- And finally, implementation is simple. It’s a short survey that does not require much infrastructure.
Cons
- The flipside to being highly specific is that customer effort score only tells you about one aspect of the entire customer experience. It can’t provide you with a clear picture of the overall client journey.
- Likewise, the simplicity of the question limits the information you receive back. The CES tells you whether or not the customer was pleased with their interaction, but it doesn’t always provide further details.
- There is no segmentation when it comes to customer effort scores, so you don’t have nuanced data coming back to you about your customer base.
- Finally, timing is everything with a customer effort score. If you don’t follow up immediately with the survey, you run the risk of missing out on useful insights.
How to Get More Out of Your Customer Effort Score
One of the best ways to improve your CES insights, and ultimately your score, is to include open-ended questions in your customer effort score survey.
These questions allow the customer to expand on what they felt worked in the interaction and what didn’t. Plus, they give you the ability to go beyond numbers to real individual opinions and experiences. This leads to new and useful insights.
When you receive these freeform responses, you can use advanced text analysis tools to automatically sort your text data by topic and easily spot trends, reoccurring issues, and areas for improvement.
This will help you pinpoint issues your customers are having when using your products and services, which may not have been highlighted in the original closed-ended question.
Further insights like these will help you enhance your customer effort score, and most importantly, your customers will be more likely to return to your products or services.
The key here is to be prepared with the correct tools to process text data. Sorting through this manually would be overly time-consuming and leave you open to too much human error.
Here’s where no-code machine learning tools like MonkeyLearn’s sentiment analyzer and survey analyzer can make all the difference.
Our tools automatically analyze the open-ended questions and quickly provide you with the insights you need to make meaningful changes.
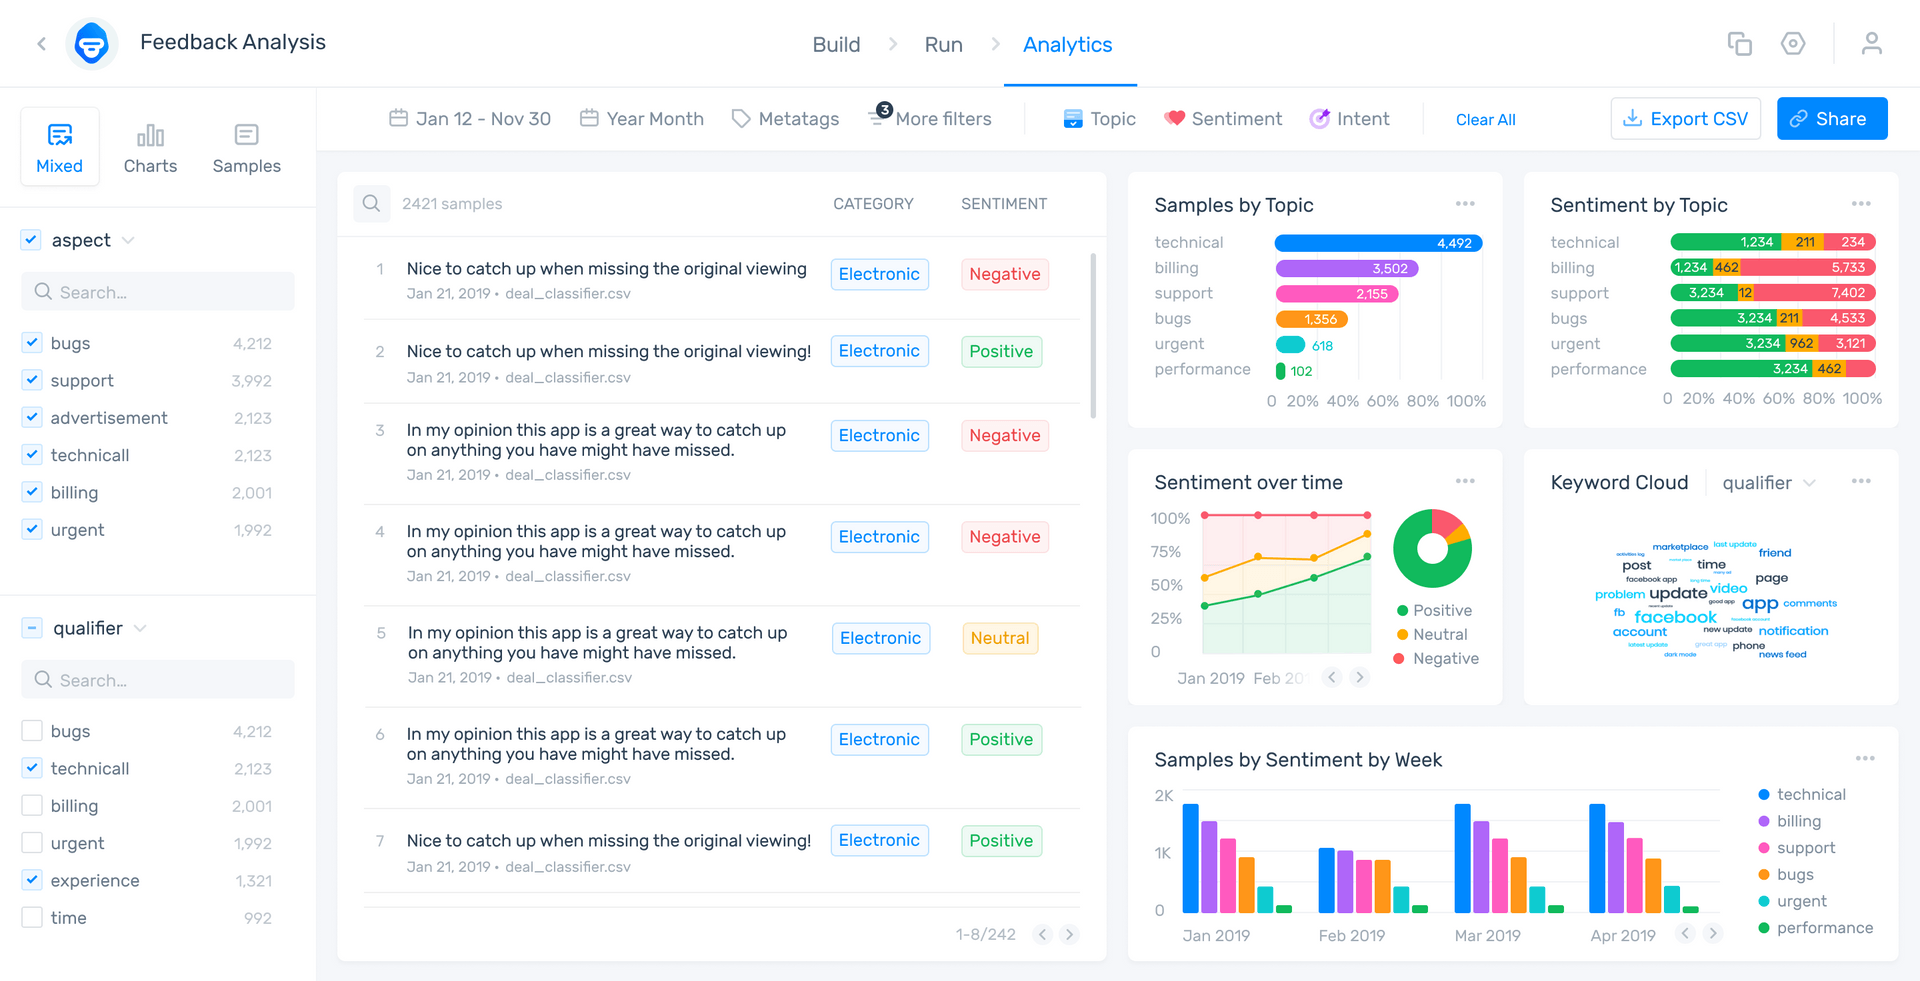
Here’s a demo of one of our feedback analysis dashboards:

Conclusion
Overall, the customer effort score is a straightforward and useful way to see how much effort your customers are putting into their interactions with you. It can predict how likely they are to stick around and/or talk positively about your brand, product, or service.
But it’s not enough to simply implement a CES survey. You need to make sure the responses you receive are detailed, and that you have tools in place to process that data.
If implemented correctly with the right analysis tools, your customer effort score can lead to improved customer experiences and, ultimately, help you retain customers.
Sign up to MonkeyLearn for free to try out our wide range of text analysis tools, and see how they can help you get the most out of your customer effort score metrics.
Alternatively, request a demo to see exactly how MonkeyLearn accurately and quickly analyzes your open-ended CES data.

Inés Roldós
June 25th, 2021


