The basic construct of a Net Promoter Score is easy to understand, hence its popularity and widespread usage. If a company has more detractors than promoters the score will be negative and vice versa. A Net Promoter Score provides companies with a simple and straightforward metric that can be shared with their front line employees. The Net Promoter Score is helpful in that it can be used as motivation for employees to improve and to provide the best customer experience possible. The ultimate objective here is to convert customers who were less than happy or unimpressed into promoters who will put the word out and allow for increased revenues and profits.
Higher Net Promoter Scores tend to indicate a healthier business, while lower Net Promoter Scores can be an early warning to dig deeper into potential customer satisfaction and loyalty issues. Net Promoter scores are often averaging quite low. Fred Reichheld, in his calculation of 400 companies across 28 industries back in 2003 (HBR article “The One Number You Need to Grow”), found that the median Net Promoter score was just 16.
What is a good NPS score?
The best NPS score is one that is continually improving. It’s hard to broadly benchmark scores across industries because they can vary widely and there is no universal scale applicable across each. Obviously the lower the score to 0, the worse, and the closer to 100, the better.
By consistently measuring NPS and comparing results to previous quarters and years, companies can gain visibility into the impact of their customer experience programs and efforts. Small gains in NPS can quickly lead to larger gains across the organization, and numerous studies through the years have found a correlation between NPS gains and financial improvements.
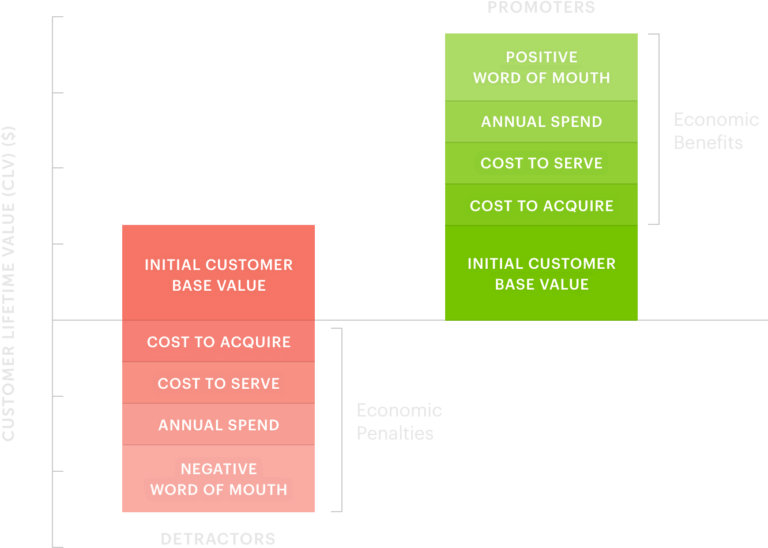
It’s clear to see how the balance of detractors or and promoters would indicate a company’s potential for success. Starting from behind, it would cost a company much more money to win back a detractor as opposed to simply keeping promoters on board. A detractor can file complaints, bog down customer service lines and will need more time and resources from the company to be served. They won’t buy more products and services from the company given their negative experience and they might very well bad mouth your brand to their peers.
The reverse is true with a customer enthusiast and promoter. They’ll buy more from the company they love, they’ll need less customer service and will refer friends and relatives. Free publicity from a promoter means the company need not spend as much on marketing and advertising! As Fred Reichheld said, “essentially promoters become the company’s marketing department.”
Bain and Co, who originally introduced this metric, have researched the correlation between a company’s growth and its Net Promoter Score. They found that for most industries, the Net Promoter Score accounts for 20% to 60% of a company’s organic growth rate. On average, the leader in an industry has a Net Promoter Score more than double of its competitors. (You can find more on Bain’s website: “NPS and growth”.)
Bain & Co shows on its website a partial list of companies using the Net Promoter Score system. The list is far from comprehensive but gives an idea of the Net Promoter Score popularity and widespread use. The list can be found here: Companies using NPS
Calculating an organization’s Net Promoter Score every once in a while is not enough in itself to bring about any longstanding value. It needs to be part of a broader ecosystem whereby the entire organization lives and breathes by it.
First off, without senior leadership sponsorship and a strong commitment to improving the customer experience, it will be difficult for any one part of the company, be it marketing, sales, operations, customer service or a customer experience team to get the necessary cross-functional adoption and accountability for the program. It needs to be a company-wide effort.
Secondly, the NPS eco-system needs to have a closed loop. Front employees need to be able to act upon real-time feedback and from insights from customers and the rest of the organization. Whether it is operations, sales, or marketing, all should be able to learn and improve from the utilization of the information obtained.
Third, the data needs to be properly analyzed. The power of the Net Promoter Score lies in its simplicity but unless a business dissects the data and figures out the root causes of its detractors’ experiences or the factors of the success that turned simple customers into promoters, it will miss out on a recipe for future growth, profitability and sustainability. For example, one is well served by reading all the comments, tagging them, classifying them and then looking for patterns. It is paramount for a company’s leadership to seek out the “whys” behind the data and to adapt and evolve accordingly.
Improve the experiences that impact NPS, with Medallia
With Medallia as your CX partner, you can identify, measure, and improve the experiences that have an impact on your company’s NPS score. The Medallia Experience Cloud can easily compute a score and, more importantly, give you insights into the “why” behind the score. As customers broadcast valuable feedback about your business through surveys, social media, review sites, and countless other channels, there’s a bounty of unstructured and disorganized data that many companies find challenging to analyze.
Medallia’s platform uses machine and human learning to automatically analyze text feedback, so you can understand what matters most to your customers and identify the ways you can take immediate, meaningful action. Uncover and quantify what your company does well and what it can fix or improve: whether it’s a product issue, support, or a logistics issue. Medallia takes the guesswork out.
Connect with a Medallia NPS Expert
Schedule time with one of our CX experts and let us help you build more advocates and promoters for your business. From relational and transactional NPS to full customer journey programs – our team can provide best practices and insights to help you get started.