Customer Service Analytics: Enhancing CX

Customer service analytics is the process of collecting and analyzing customer feedback to discover valuable insights. It can help you better understand your customers’ needs and expectations, lead to improved customer experience (CX) strategies and increase customer loyalty and retention.
With more options than ever to interact with companies, customers crave fast, efficient, and personalized experiences. However, customers say that most companies fall short when it comes to meeting their expectations. Even more alarming is that 32% would stop doing business with a brand after one bad experience.
We all know that customer satisfaction is key to improve brand loyalty and create a positive reputation that will ultimately lead to more sales opportunities. But how can you close the gap between what customers expect from customer service and the quality of support they are actually getting? This is where customer service analytics comes into play.
Building a solid strategy, supported by data and analytics, is essential to understand your clients, identify recurring issues (and fix them), and get actionable insights to improve customer retention.
Most companies are already tracking quantitative operational metrics like first response time (FRT) and average time to resolution to measure the performance of their customer service teams. Also, many businesses are monitoring customer experience (CX) by quantifying scores of customer satisfaction and customer effort surveys.
However, it’s also important to leverage qualitative data, like the content of customer support tickets and open-ended responses in surveys. AI companies, like MonkeyLearn, are already helping customer service teams sort huge amounts of qualitative data, streamlining their processes, and reducing time-consuming and repetitive tasks.
By using Artificial Intelligence (AI) in customer care, you can automatically:
In the following sections, we’ll explain why customer service analytics is important to your business, how you can use AI to uncover insights from qualitative data, and introduce tools to help you make sense of all your data.
Read along or jump to the section of your interest:
Let’s get started!
What Is Customer Service Analytics?
Customer service analytics involves gathering and analyzing different sorts of customer data and metrics, in order to get actionable insights that allow you to evaluate your strategy and design better customer experiences.
Each interaction with your customer service team ― from support tickets and NPS surveys to live chat, emails, and social media comments ― is a chance to collect data. Combining quantitative and qualitative data is the best way to get a panoramic view of customer experience and understand what your clients need and expect from your product or service.
Analytics can help you understand your customers’ journey and identify the most frequent issues they encounter. Also, you can use analytics to predict the behavior of prospective clients based on previous customer actions and be better prepared to assist them.
Customer Service Analytics Use Cases
Customer service analytics is crucial to evaluate the quality of your customer support, by identifying what’s working well and which aspects need improving.
Most companies keep track of customer service KPIs like first response time (FRT), average time of resolution, and customer satisfaction score (CSAT), among others. However, thanks to AI, it is now possible to take your data strategy to a more advanced level, analyzing not only quantitative but also qualitative data on a large scale. And what’s more, you can do this with data you probably already have in your help desk, like customer support tickets and open-ended responses to NPS surveys.
Qualitative data is unstructured; this means it’s not organized in any predefined way and therefore, it can be hard to manage and analyze. Fortunately, AI-powered algorithms can be trained to automatically tag this data and extract meaningful information.
In this section, we’ll cover the main performance metrics used in customer service, and then focus on qualitative data.
Customer Service Success Metrics
Customer service teams use different Key Performance Indicators (KPIs) to assess the quality of their work and detect opportunities for improvement.
Some KPIs measure operational efficiency and track your customer support performance by answering questions like, “how long does it take to answer a new ticket?” or “how many iterations are necessary to solve a client’s issue?” Other metrics evaluate customer experience, finding out things like “what percentage of customers would recommend this product?” or “what’s the average level of satisfied customers after an interaction with customer support?”.
There’s a wide array of KPIs you can monitor to measure customer service performance and customer experience, and they are usually available in most help desk solutions. These are some of the most relevant:
Measuring Customer Service Performance
Average First Response Time: This metric indicates how long a customer has to wait to get an initial response to their support request. The acceptable time for a first response varies widely across different industries and channels. Stats show that 80% of customers expect to receive a reply to social media questions or complaints within 24 hours, while live chat queries demand a more immediate answer: just seconds.
Average Reply Time: Measures how long it takes for your customer service team to follow up with clients in all interactions (including first responses and further interactions). Long reply time is linked to customer frustration and low rates of satisfaction.
At Zapier, tracking average response time allows the support team to get an overview of how responsive they are in relation to the volume of tickets they receive. Here’s an example of their results:
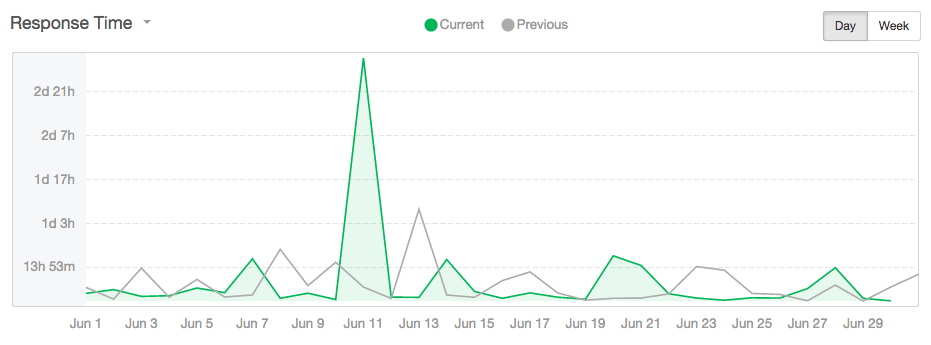
This chart shows how Zapier measures Average Response Time. Source
However, Zapier doesn’t consider this the best indicator of how effective their support team actually is, since averages can be easily affected by outliers (a ticket that takes longer to reply to, resulting in a negative impact on the total average response time – even if the rest were replied quickly).
That’s why the team at Zapier also relies on Response Time Bands, a metric that shows the percentage of tickets that get replies within a specific timeframe. This metric provides them with a more realistic view of how long their customers have to wait for a reply, and allows them to track if they are improving their response times:
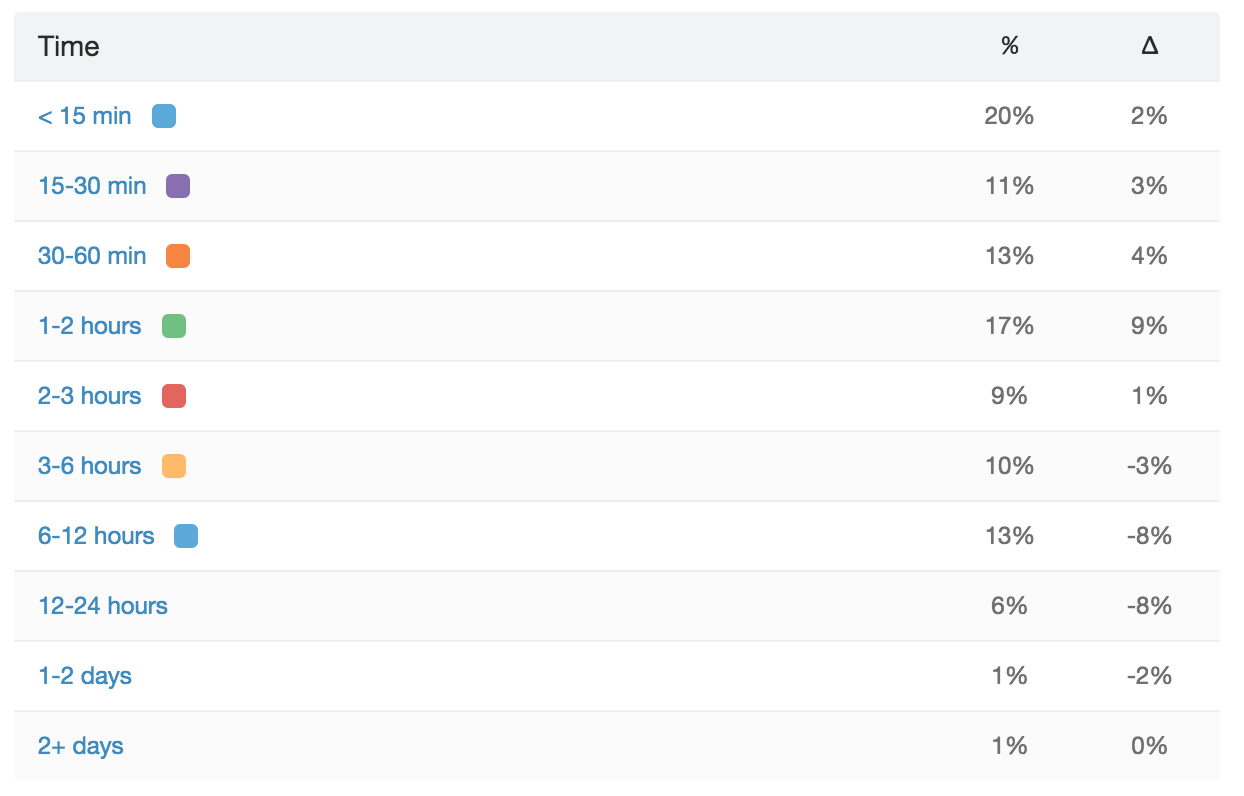
Zapier uses Time Response Bands to track the support experience of their customers. Source
First Contact Resolution Rate: this involves solving a customer’s request in one single interaction and it’s strongly correlated with customer satisfaction. In fact, more than 80% of consumers who switched to another company due to poor customer service say they could have been retained if their issue had been solved in their first interaction with customer support.
Average Number of Replies per Request: this metric measures how many touch-points are required to solve a single customer request. When this number is high, it may indicate that you’re not routing tickets accordingly and also, that your customers are putting too much effort into getting their issues solved (in fact, 89% of customers get frustrated because they need to repeat their issues to multiple representatives).
Average Resolution Rate: the percentage of support requests solved by a customer service team, from the total amount of tickets received. This KPI allows you to measure productivity and efficiency. Factors like the volume of tickets you receive, the number of agents on your team and the complexity of the issues you need to solve can affect this rate.
Measuring Customer Experience
- Net Promoter Score (NPS): it’s the rate of customers that would recommend a brand, product, or service to their friends or colleagues. This is an indicator of customer satisfaction and loyalty, which can also lead to positive referrals and business growth.
NPS scores let you know if you are meeting customers’ expectations, and classify your customers into Promoters, Passives, and Detractors. Here’s an insider’s view into Hotjar’s first year analyzing NPS. This is how their global NPS score looked like 2018:
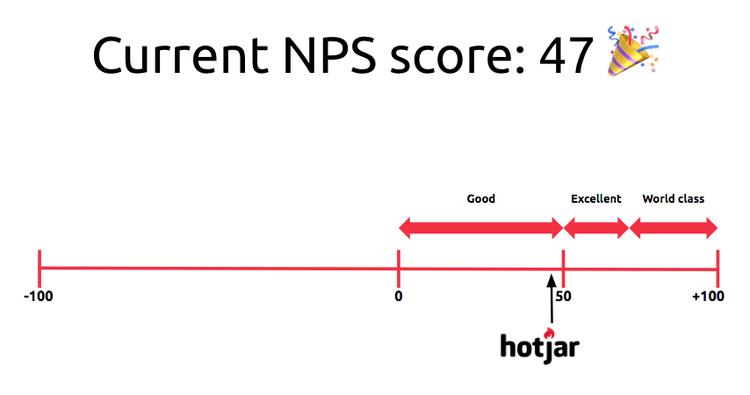
Hotjar global NPS score. Source
An interesting approach they implemented was splitting NPS surveys in two: one for free users, and another one for paying customers. The result showed that the NPS score of paying customers was 10 points lower than the one of free users, indicating that clients that are actually paying for the product and, therefore, using it more, have higher expectations:

The average NPS score for free users was 54. Source

The average NPS score for paying customers was 44. Source
- Customer Satisfaction of Customer Support (CSAT): this KPI tracks how satisfied customers are with the quality of your customer service. By sending a short survey after an interaction with your customer support, you can measure how effective you are at handling their inquiries, and identify dissatisfied customers. For example, here’s a rating feature that Trello support team sends to its users via email after a customer support interaction:

The responses are compiled and used as an indicator of customer happiness, as you can see below:
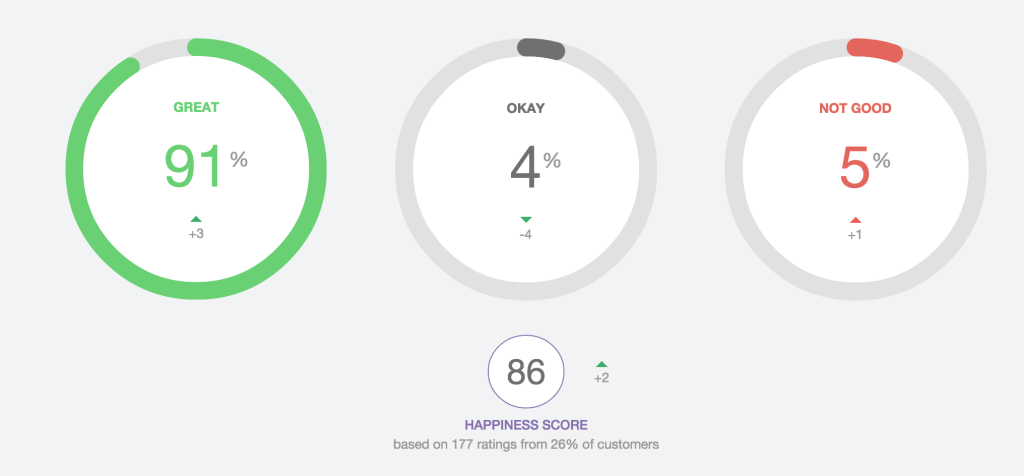
Trello’s support team also follows up on users that have had bad customer experiences and gets insights from them to improve the quality of their service. Thanks to this feedback, they have made changes to their auto-responses and even modified the way they handle certain types of issues.
- Customer Effort Score (CES): This score measures the effort it takes customers to get their issues solved. High-effort experiences often include being transferred to different agents, having to explain the same issue several times, and needing to change to other support channels in order to get a reply to their inquiry. Low-effort customer experiences are related to loyalty and an increase in repurchase rates. Also, low-effort interactions cost companies 37% less than a high-effort interaction.
Qualitative Customer Support Data
As we’ve seen earlier, quantitative data can provide valuable insights on your customer service, by pointing out which aspects of your support are working well and which ones require improvement. But, even though you can get objective indicators through quantitative data (like observing a decrease in your customer satisfaction score or a high rate of customer churn), numbers fail to explain the ‘why’ that underlies customer behavior.
Analyzing qualitative data, like open-ended responses to NPS surveys or the content of customer support tickets, is important to understand the reasons behind metrics and scores.
What aspects of your service are most frustrating for your customers? What are their most frequent complaints? What questions are they asking the most?
Qualitative data provides you with an in-depth knowledge of your customers’ problems and can be the key to find the best way to solve them.
Data from Customer Support Tickets
Omni-channel customer service strategies are on the rise, allowing customers to reach out to a company on the channel of their choice. For customer support teams, this means handling tickets that may arrive via email, live chat, mobile apps, social media, and phone calls. Also, it implies dealing with a larger volume of support queries.
Help desk software, like Zendesk, Freshdesk, and Front, can help you organize your workload by centralizing all your incoming support tickets.
When a customer sends a request via email or complains about your brand on Twitter, for example, a customer support ticket appears in your help desk. Each support ticket contains all the interactions between the customer and the customer support rep related to a specific issue or question.
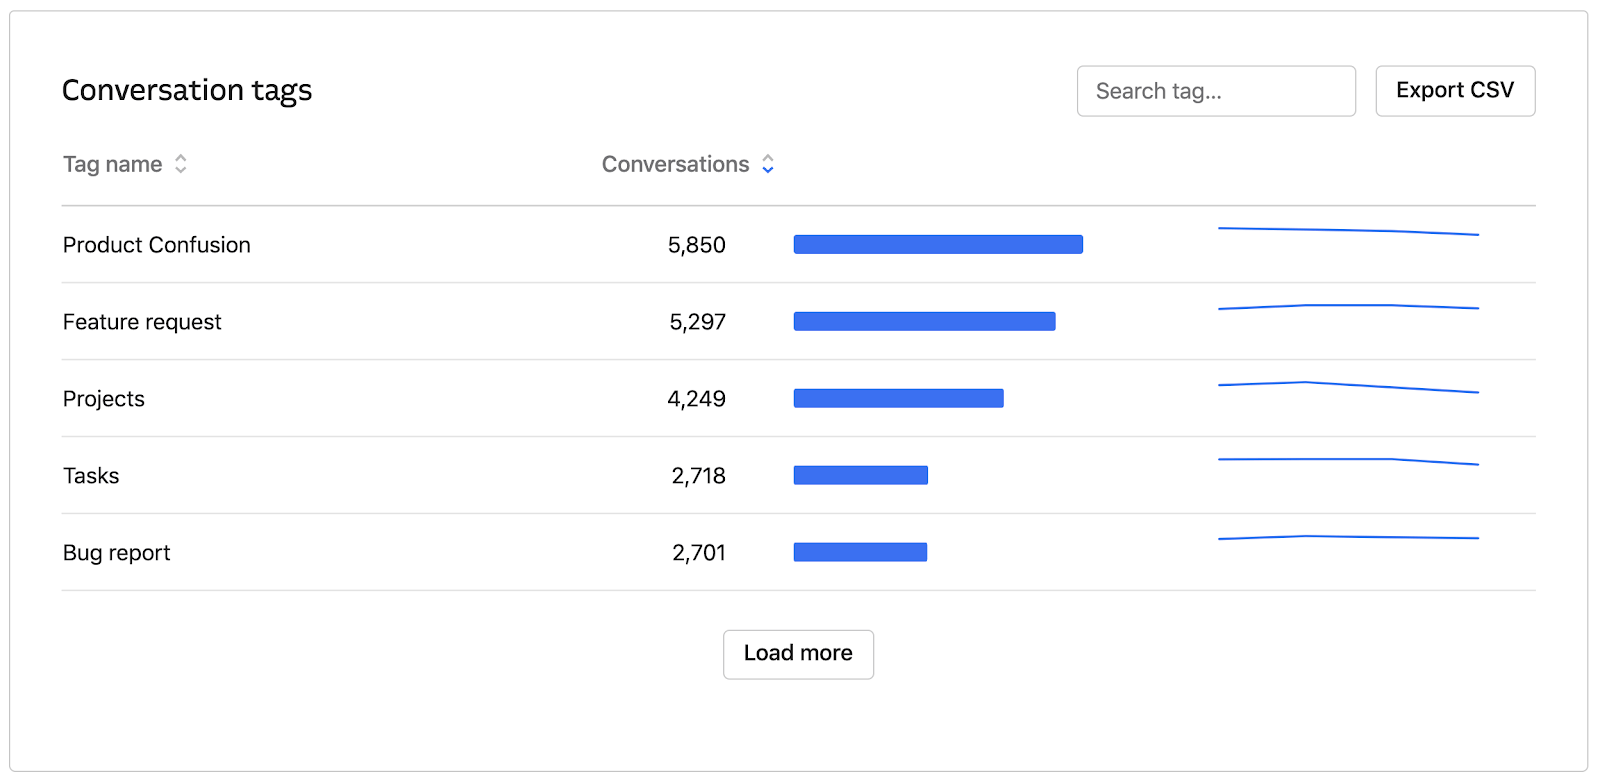
Support tickets can provide valuable information to improve your customer service and your product as a whole. You might tag your tickets based on their topic, which can help you understand your customers’ most common issues, feature requests, and questions, and detect trends related to them. For example, here’s a report showing the most frequent tags in Intercom conversations:
However, analyzing large volumes of support tickets may not be as easy as dealing with quantitative data, unless you’ve got the right tools. Customer support tickets are considered unstructured data. This means that, in order to make them manageable and to be able to extract what’s relevant from them, you need to categorize the data in a certain way.
Fortunately, artificial intelligence can be of great help at this stage. The next section will go more into detail on how to use AI to analyze customer support tickets.
Data from Customer Feedback
Customer feedback provides you with first-hand information on what your clients think about your service. Analyzing this feedback as a whole (leveraging not only quantitative but also qualitative data) can add a lot of value to your analytics strategy.
NPS surveys, for example, have a qualitative component besides providing a 0 to 10 score. The follow-up, open-ended question that inquires on the reasons for that score can provide in-depth insights on how customers feel about your service. Let’s say that a customer leaves a low score when asked to rate your customer support. Then, they explain that even though their issue was solved, they had to wait 3 days to get their first reply.
Here’s an article on how InVision uses qualitative data in NPS surveys to feel the pulse of their customers, and find out if they’re having trouble with a feature or process with their product. Then, they analyze that feedback and make improvements based on the impact on the user experience, deciding what needs to be fixed right away and what can wait a bit longer.
Like customer support tickets, open-ended responses are unstructured data, and it’s faster, more accurate and scalable to categorize and process this type of data with AI-powered algorithms – as we’ll see in the following section.
Role of AI in Customer Service Analytics
Artificial Intelligence (AI) is a branch of computer science that creates machines capable of simulating human intelligence. Its main goals are related to perception, problem-solving, and learning.
AI-powered systems are driving innovation in business, allowing companies to automate processes and get relevant insights from massive sets of data. Thanks to machine learning and natural language processing (NLP) ― two major subfields in AI ― it is possible to create algorithms that learn from previous data and can be trained to understand language like humans do.
There are many useful applications of AI in customer service. Machine learning models can help you automate daily tasks such as:
- Tagging tickets and routing them to the most appropriate agent
- Detecting the most urgent issues
- Capturing valuable insights in your qualitative data.
Let’s say you want to analyze emails, support tickets, and social media interactions to find out the main topics or issues that your customers refer to when they reach out to your company. If you do it manually, you would need to collect all the data, read each support ticket, and classify the information under different categories. When faced with large volumes of tickets, this process ends up costing a lot of time, effort, and money. But what if you could train a machine to deal with these tasks?
Machine learning models can automatically extract and classify large volumes of unstructured data in just seconds, saving you a lot of time and resources. There are different models you can create, depending on the type of analysis you want to do (topic analysis, sentiment analysis, keyword extraction, etc).
You can then integrate them into your help desk software so that they can automatically analyze customer support tickets. Finally, you can use the results from the automated analysis to build graphs and reports that will take your customer service analytics to the next level.
In this section, we’ll explain the main tasks you can perform to analyze qualitative data (in this case, customer support tickets) with AI:
Identify Topics or Issues in Customer Support Tickets
Customer support teams receive all kinds of support tickets every day: from customers experiencing technical issues and sending feature requests to those asking questions related to pricing or billing, and many others.
Support tickets are an invaluable source of information, and reveal what your clients often ask in relation to your product or service. And yet, only a few businesses are actually leveraging this data. Knowing the most frequently mentioned topics in your tickets can help you identify product issues and even come up with new ideas based on your customers’ suggestions.
Take the case of Slack, for example, which receives more than 8,000 Zendesk help tickets and +10,000 tweets per month. Consistently tagging incoming tickets allows them to keep track of how many people are asking for a certain feature or a new kind of integration. This tweet, for example, should be tagged as Feature Request:

Tagging customer support tickets is also key for monitoring queries after a big event. Let’s say your company has just released a new software update and you send out a release note to your customers. Monitoring your tickets to see if there’s a spike in those tagged as Bugs or Technical Issues can help you find out if there are any issues to take care of. Here’s an example of a reported issue related to a recent software version upgrade:

However, going through this tagging process manually can be a cumbersome and time-consuming task, especially when you have to deal with hundreds (or thousands!) tickets per month. Fortunately, you can automate this process with topic analysis, a machine learning technique that automatically tags text data based on its theme.
After being trained with examples, a topic classifier can learn to recognize patterns and categorize your support tickets based on predefined categories.
To come up with a list of tags and sub-tags you need to be familiar with the type of tickets you often receive. This, of course, can vary widely across industries. If you are a SaaS company, for example, you may create tags like Technical Issues, Feature Requests, Bugs, UI/UX, etc.
One of the best advantages of using machine learning to automatically tag tickets and find relevant topics is that it is scalable: once you’ve created a model, you can analyze as much data as you want.
Creating a customized topic classifier is not as complex as it may sound. With an AI platform like MonkeyLearn, you can have it up and running in just a few minutes. Here’s a tutorial that shows you how to build your own text classifier.
Detect Urgency in Customer Support Tickets
For a customer service team handling hundreds of support tickets every day, identifying the most urgent requests is key to decide what needs to be prioritized.
When it comes to analytics, knowing the percentage of urgent tickets that a team receives on a monthly basis, for instance, can provide insight into the level of frustration expressed by customers. Also, analyzing urgent tickets can help you identify patterns, like a sudden spike of urgent queries after a product launch, or specific times of the year where you may receive more complaints or requests (such as Christmas for retail companies, or the holiday season for airlines and travel agencies).
Urgency detector models are trained to identify specific words and expressions which indicate issues that require immediate attention, like ‘urgently need assistance’ in this example below:

Obtaining quantifiable data about urgent customer support tickets can help you make smart decisions, like hiring temporal customer reps at the busiest times of the year, or providing extra training to your team before the launch of a new product or feature.
Want to see how you can detect urgency with AI? Here’s a public urgency detector model you can try right away.
Analyze Sentiment in Customer Support Interactions
Customer support interactions are filled with emotions: customers may feel frustrated because they are experiencing a technical issue, angry if they were charged the wrong amount of money, or grateful if your customer service team resolved a critical issue quickly.
Sentiment analysis ― an automated process that can identify and extract opinions from text ― can take your customer service analytics to a whole new level, allowing a deeper understanding of what drives customer satisfaction, and what are the most frequent reasons for customer churn. Also, monitoring customer support interactions with your clients after specific events, like launching an update of your product or changing your price structure, for example, can provide you with smart insights to improve customer experience.
A sentiment analysis classifier detects patterns in customer support tickets and tags each of them as Positive, Negative, _or _Neutral _based on polarity. The tweet below, for example, is from a frustrated customer who is about to switch companies as a result of poor customer support. This interaction would be tagged as _Negative:

Tracking sentiment analysis over a long period of time can provide insight for training customer service reps. Knowing what your customers need and expect from your support can help you find better ways of engaging and empathizing with clients. Also, analyzing which experiences went well (either for your company or your competition) can help you improve the way you handle customer queries.
At MonkeyLearn, we analyzed customer support interactions on Twitter to find out how four big telcos were perceived by their clients. We downloaded tweets mentioning Verizon, T-Mobile, AT&T, and Sprint, and used a sentiment analysis classifier to identify if customers were referring to these companies in a positive, neutral, or negative way. Here’s what we found:
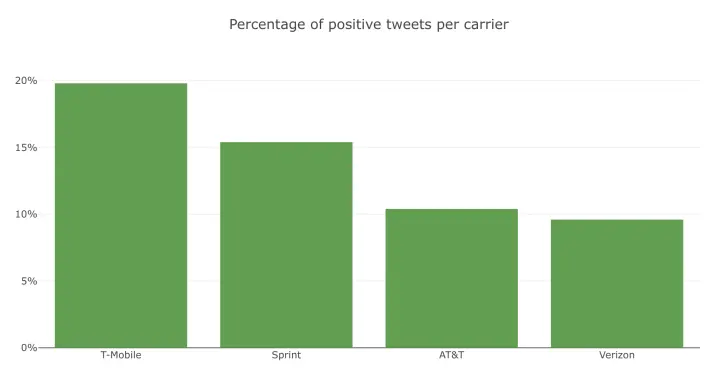
The graph shows the percentage of positive tweets for each company: surprisingly, the smaller companies received the most positive tweets, while each company received a similar or lower number of negative tweets – with one exception. Verizon received more negative than positive tweets, and it turns out that the carrier has the worst image on Twitter:

Besides classifying opinions based on polarity, we also wanted to analyze what customers were actually saying, to understand why T-Mobile was receiving the most positive tweets and why Verizon was falling behind.
With keyword extraction, we identified the most relevant words and expressions in all tweets and found that T-Mobile interactions were much more engaging – their customer service team was addressing customers on a first-name basis, and both customers and agents were using emojis, and words that suggested more informal tone in conversation.
Verizon’s tweets, on the other hand, were more dry and formal. These results would suggest that customers respond better to informal interactions that are more personalized.
Negative comments were mostly related to bad customer service, bad reception, and high prices, though some of them were unique to one carrier, like those complaining about Verizon’s unlimited plan and the quality of T-Mobile LTE service.
Getting started with sentiment analysis is quite easy. In fact, there are many online tools you can use to take your first steps, even if you don’t have any programming skills. For example, here’s a tutorial explaining how you can build a custom sentiment analysis model with MonkeyLearn.
Extract Keywords in Customer Support Tickets
Classifying your customer support tickets based on topics or issues gives you an overview of the types of tickets you are receiving. You could notice, for example, that 60% of your tickets fall under the tag Technical Issues. However, if you take a closer look at them, they’ll probably look like this:
“I can’t log in”
“Site is down”
“I can’t add my credit card”
So, how do you know what the specific issues in each ticket are without reading them? Keyword extraction helps you detect the most relevant words and expressions in each ticket automatically, summarizing the content for you. That way, you can have more granular insights, like identifying the most common technical issues that your customers have, or monitoring if there are similar technical issues reported after you release a new feature.
Here’s an example of a user complaining about not being able to add a credit card to a new customer account, and the main keywords extracted by a machine learning model:
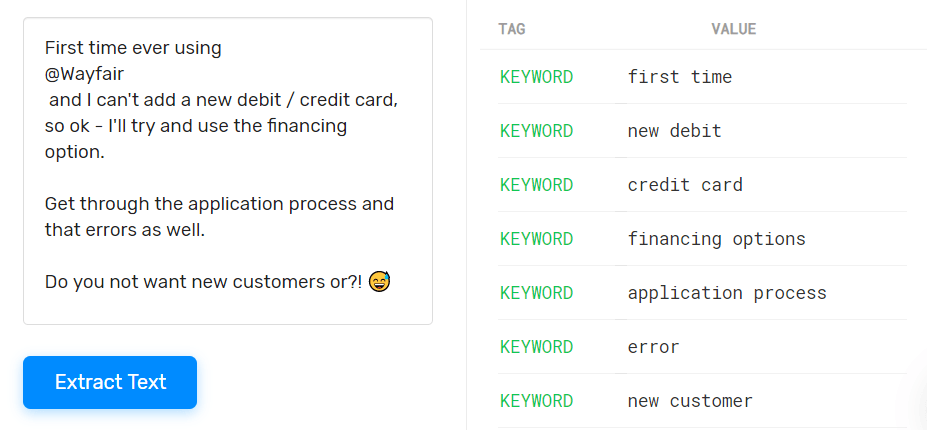
Knowing the most relevant keywords in your customer support tickets can enhance your data-driven strategy, by providing concrete evidence of your customers’ queries and requests, and allowing you to make improvements. For example, if many clients report they don’t know how to use a certain feature in your software, you may want to improve their experience by uploading a tutorial video or improving FAQs.
Want to give it a try? Paste any text into this public keyword extractor model or follow this tutorial to build a custom keyword extractor with MonkeyLearn.
Visualize the Results
Customer service analytics provides quantitative and qualitative insights that can be used to improve your clients’ support experience. However, it’s key to share relevant findings with the right teams within your business. Visualization tools can help you transform complex data into actionable, attractive, and easy-to-understand information.
There are many online tools available that allow you to create powerful graphs, reports, and dashboards. Some of these tools are native to customer service software, while others are business intelligence (BI) tools specifically designed for analytics. Let’s take a closer look at each alternative:
Customer Service Software
These tools are integrated into the customer service software where your data is generated and stored. They are usually intuitive and easy to use, though they can be more limited in the type of visualizations, graphs, and dashboards available, as well as in their customization options. This is a simple and convenient option, but if you are looking for something more complex and tailored to the particular needs of your company, you should opt for specialized BI tools.
Here are two tools you can try for customer service analytics:
Zendesk Explore
Zendesk Explore is Zendesk’s analytics and reporting tool, which enables you to connect to your customer service data and turn it into actionable insights. You can create visualizations, like the one in the image below, by using their pre-built solutions or design your own custom dashboards using the tools in Explore Professional.
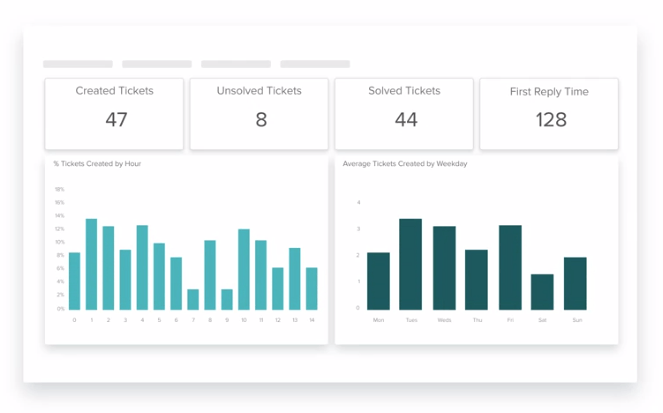
Then, you can easily share your report with the rest of your company. Want to get started? Here’s a tutorial that walks you through the steps to get up and running with Zendesk Explore.
Freshdesk Analytics
Freshdesk Analytics helps you make sense of the customer data in your help desk. You can take advantage of curated reports or create custom reports with minimum effort to keep track of different performance and customer satisfaction metrics.
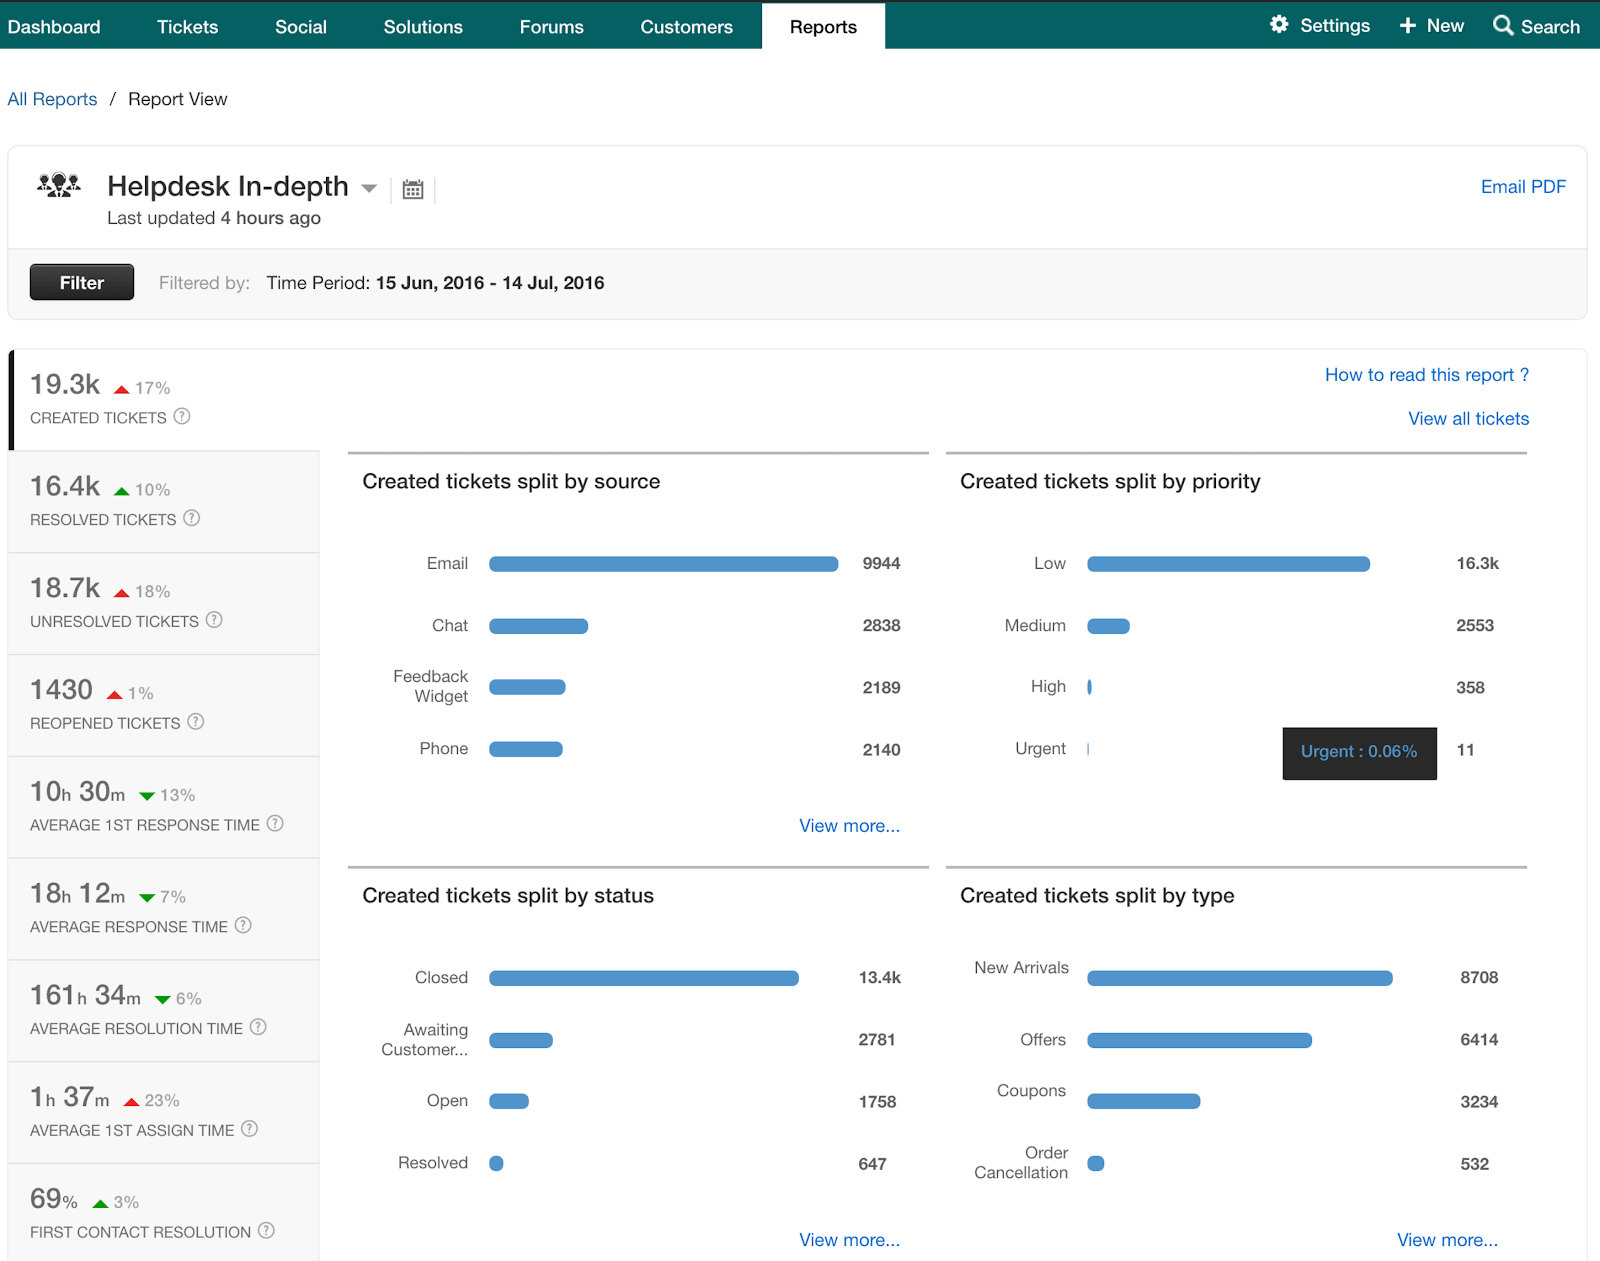
Among other features, you can use filters to slice your data and decide which metrics you’d like to focus on, and monitor agent and group performance. In all cases, you can easily export the results as CSV files. Learn more about Freshdesk analytics and how you can get started.
Business Intelligence Tools
BI tools enable you to connect to a customer service software such as Zendesk, Freshdesk, or Help Scout and create reports and customized dashboards. Even though these tools can be harder to use than native tools (you need to use an integration or, when that’s not available, an API to connect to your help desk software), they are more flexible and offer plenty of customization options, since they were specifically built for analytics.
Here are some of the main data visualization tools:
Google Data Studio
Google Data Studio is a free and easy-to-use data visualization tool. You can connect it with different data sources and create customized interactive reports (‘dashboards’) in just a few steps.
Looker
Looker, a business intelligence and data analytics tool, allows you to build interactive visualizations that update in real-time. They offer pre-built solutions (‘Looker Blocks’) that you can specifically use for customer service analytics. Check out these videos to get started with Looker.
Tableau
Tableau allows you to create data visualizations in a very fast and simple way. You can import data directly from your help desk and create dashboards to track and analyze support interactions. Here’s a video tutorial that can help you take your first steps with Tableau.
The Benefits of Customer Service Analytics
The more you know your customers, the more value you will be able to provide them through a customer-centric service. Implementing a data-driven approach to customer service can have a significant impact on your business. In fact, 50% of business leaders who are investing in data analytics see an increase in customer loyalty and retention, as well as an improvement in their understanding of the customer journey.
Analytics help customer service teams extract different customer insights and proactively act upon them. For example, you might notice that new clients are having a tough time learning how to use your software, in which case you can update and improve your documentation, tooltips, guided tours, and FAQs to pave the way for future customers.
Below, we’ve outlined some of the benefits that customer service analytics can provide to your business:
Understand Your Customer Journey
Customer service analytics shows the big picture of how customers interact with your company, allowing you to map out the customer journey. You can discover patterns in the behaviors of satisfied customers (and take notes of the things that are working well), and also identify what are the most frequent issues or bottlenecks that lead to negative results. A spike in customer support tickets, for example, may indicate there’s a technical issue that needs to be immediately fixed.
Identify Customer Pain Points
By analyzing customer support interactions, you can find out which issues are more frustrating for your customers, and which aspects worry them the most. Knowing your customer pain points (that is, the problems that they want to solve with your product) can put you one step ahead when it comes to finding the best solution for their issues and delivering a positive experience.
Monitor Real-Time Customer Feedback
Sending a short survey just after a support interaction can provide you with instant and timely feedback. Customers might also leave reviews or comments on social media right after they’ve purchased a product, or subscribed to a service, for example. By monitoring customer feedback in real-time, you can track the performance of your team, identify disgruntled customers (and take action to prevent them from churning), and monitor customer satisfaction.
For example, if your customers complain about jumping from agent to agent and having to explain their issue many times before it is solved, then you should revise your ticket routing strategy and make sure tickets are being triaged to the most competent agents for each topic.
Anticipate Customer Needs
Predicting customer behavior is one of the most interesting advantages of customer service analytics. By studying historical customer data, you can be more prepared for issues or events that may arise, spot trends, and adapt your customer support solutions to your client’s needs.
Some companies are using AI-powered algorithms to predict when customers are at risk of churn, and provide them personalized retention offers.
Measure Overall Customer Satisfaction
Happy customers are more likely to re-purchase and leave positive recommendations. In fact, 80% of consumers will recommend a company to friends and family after a good experience, while 40% will post about it on social media.
Customer service analytics ― whether it’s analyzing sentiment on customer support interactions, or checking metrics like Customer Satisfaction of Customer Support (CSAT) or NPS scores ― can help you measure customer satisfaction and identify business promoters.
The best thing about analytics is that it provides you with actionable insights on the specific reasons why customers are happy or not with your customer service. That way, you can know exactly what drives customer loyalty and which aspects of your business require improvements.
Improve Customer Retention and Loyalty
For a company, acquiring a new customer is 5 times more expensive than retaining an existing customer. In this scenario, improving customer retention and loyalty is key to business growth.
Analytics allows your customer support team to identify how their customers feel and detect dissatisfied clients at risk of churn. You can also leverage data from cancellation surveys, for example, to understand the motivations behind customer churn:
- How much effort is required from customers to solve their issues?
- Is your average response time too long?
- Recent downtime or outages causing a spike in cancellations?
Only after analyzing this data, you’ll be able to design a solid strategy to improve customer retention.
Wrapping up
One of the main challenges in customer service is being able to meet (and exceed) rising customer expectations. The more you know your customers and understand their particular needs, the more prepared you’ll be to deliver outstanding customer experiences.
Customer service analytics provides all kinds of insights on how your clients interact with your support team across different channels. Most companies keep track of customer success metrics to analyze the performance of their support team and, also, to monitor customer satisfaction.
Quantitative data, like average first response time, first contact resolution rate, average time of reply, or customer effort score (CES) can give you an overview of how effective your customer service is. However, though less frequent, analyzing qualitative data ― such as customer support tickets or open-ended responses to NPS surveys ― can be extremely valuable to understand the story behind the numbers: the actual reasons that drive customer behavior and opinions.
Thanks to AI-powered algorithms, it’s possible to manage and analyze large sets of unstructured qualitative data and turn it into actionable insights to improve your customer experience. You can use machine learning to identify the main topics of customer support tickets, detect urgency and sentiment in support interactions, and automatically extract relevant keywords. And what’s more, you can integrate these machine learning models into your help desk, so you can analyze data as and when it comes in without having to go elsewhere.
Once you’ve analyzed your data, you can use visualization tools to create graphs, reports, and charts that showcase the results in an attractive and clear way. Some customer service software have their own tools for analytics & reporting, and even offer pre-built models you can use with minimal effort. However, for a more customizable option, you can opt for a business intelligence tool that you can connect with your help desk via integrations or an API.
Even though you may think of customer service analytics as a rather complex process, there are many online tools that make machine learning accessible to users with little or no programming skills.
With MonkeyLearn, for example, you can create customized models for topic detection, sentiment analysis, and keyword extraction, among others. Want to get started? Just sign up for free and start experimenting with AI right away or request a personalized demo by one of our experts!

Federico Pascual
November 14th, 2019


