How To Calculate Your Net Promoter Score

Acquiring and retaining devoted customers is what every organization wants because customer loyalty is powerful.
The likelihood of selling to an existing customer is 60-70% whereas selling to a new customer is 5-20%. When you have loyal customers they are more likely to recommend you to their friends and colleagues too. All of this increases the potential for your business to grow.
In order to foster a loyal customer base it is important to check in with your customers regularly. Then, you can adapt your customer experience according to what you’re hearing.
But, how do you measure customer loyalty?
Enter Net Promoter Score (NPS), both a handy metric used to measure loyalty and a strong predictor of potential growth. In order to get the most of NPS, however, you have to know how to accurately calculate your score and then analyze your findings.
Let’s get right into it. Feel free to navigate to the section that interests you the most here:
- What is The Net Promoter Score?
- Types of NPS Surveys
- How to Calculate The Net Promoter Score
- How to Improve Your Net Promoter Score
- Conclusion
What is The Net Promoter Score?
Net Promoter Score (NPS) is a customer satisfaction metric which measures how happy your customers are with you. It was first created by Fred Reichheld in the 90s then developed further by Bain & Co.
Making sure your current customers are taken care of, i.e. focusing on retention, matters. Studies from Temkin show loyal customers are over four times more likely to repurchase from the same company and over five times more likely to forgive a company’s mistake.
What the team at Bain developed was a simple survey question which garnered results that could predict customer behavior. It also proved more effective than the longer surveys used at the time. This became the metric that they called the Net Promoter Score.
Your NPS is usually calculated by asking your customers the following question:
“On a scale of 0 to 10 how likely are you to recommend us to a friend or colleague?”
This initial question can then be followed by an open-ended question. We’ll get to why this is a good idea later on.
Types of NPS Surveys
There are two types of NPS surveys that you can deploy. The first being relational, the second transactional. Both give you an indication of customer loyalty and therefore business growth or decline.
Relational NPS Surveys
Relational NPS surveys give you a grasp of how your customer feels about their experience with your organization as a whole. They are deployed at neutral intervals such as quarterly or yearly. When deployed periodically, these surveys can help you track peaks and troughs in your customers’ experiences.
If you are looking to measure overall loyalty, relational NPS surveys are the most useful because they can provide a fuller picture of your customer experience.
Transactional NPS Surveys
Transactional NPS surveys are conducted at specific touchpoints within your customer’s journey. For example, this survey could be sent out following a purchase or after an interaction with a customer service agent. This will give you data on how satisfied your customers are with these particular touchpoints and interactions.
Transactional surveys give you actionable insights on a more granular level, as they relate to specific sections within your customer journeys.
You can combine both transactional and relational NPS. The benefit of this is that you get both holistic and specific insights. For instance, you can find out your customers' overall perception of your company and also drill down into their purchasing experience to identify and fix pain points. You can also use these surveys in conjunction with other customer experience metrics like Customer Effort Score (CES) or Customer Satisfaction Score (CSAT).
So, once you’ve chosen your type of NPS and gathered your results, you’ll need to know what they mean. Let’s get into how to calculate your NPS score and what it reflects.
How to Calculate The Net Promoter Score
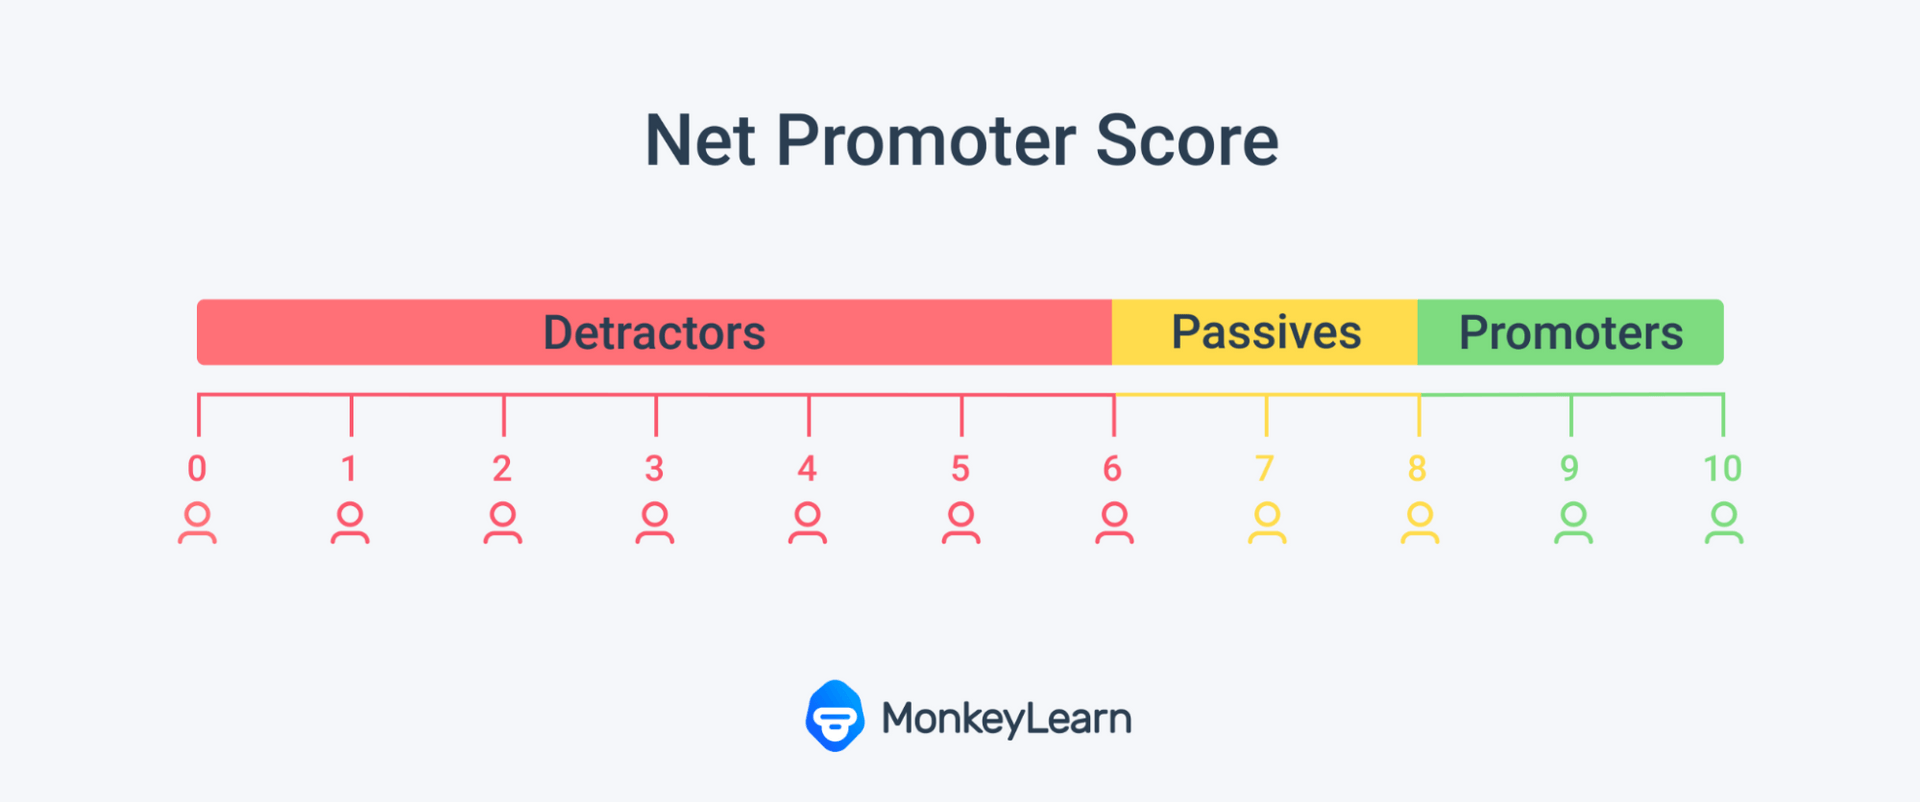
After getting the results, respondents are grouped into the following categories depending on the score they gave:

Promoters (9-10): are what you want the most of. These customers are your brand ambassadors and will likely refer you to friends and family. They’re also likely to make repeat purchases. If you have a lot of promoters, your potential business growth looks good.
Passives (7-8): are moderately satisfied with your products/and or services, but they are not loyal. They would happily switch to a competitor if given a better offer. As these customers are easily swayed, it’s a good idea to do your best to try to convert them to promoters before you lose them. This means understanding what is working for them (or not) and acting on that.
Detractors (0-6): are what you want to prevent. These are customers that are actively dissatisfied with your company and would go so far as to warn friends and colleagues against your company.
Once you know how many promoters and detractors you have, getting your score is easy. To calculate your NPS score, you simply subtract your percentage of detractors from your percentage of promoters.

For example, if 60% of your respondents are promoters, 10% are passives and 30% are detractors your score would be 30 (60 - 30 = 30).
You’ll notice that your passives don’t factor into this equation. This doesn’t mean you can ignore them. As we’ve mentioned, passives are a potential goldmine. They’re also closer to being promoters than detractors are, therefore potentially easier to convert.
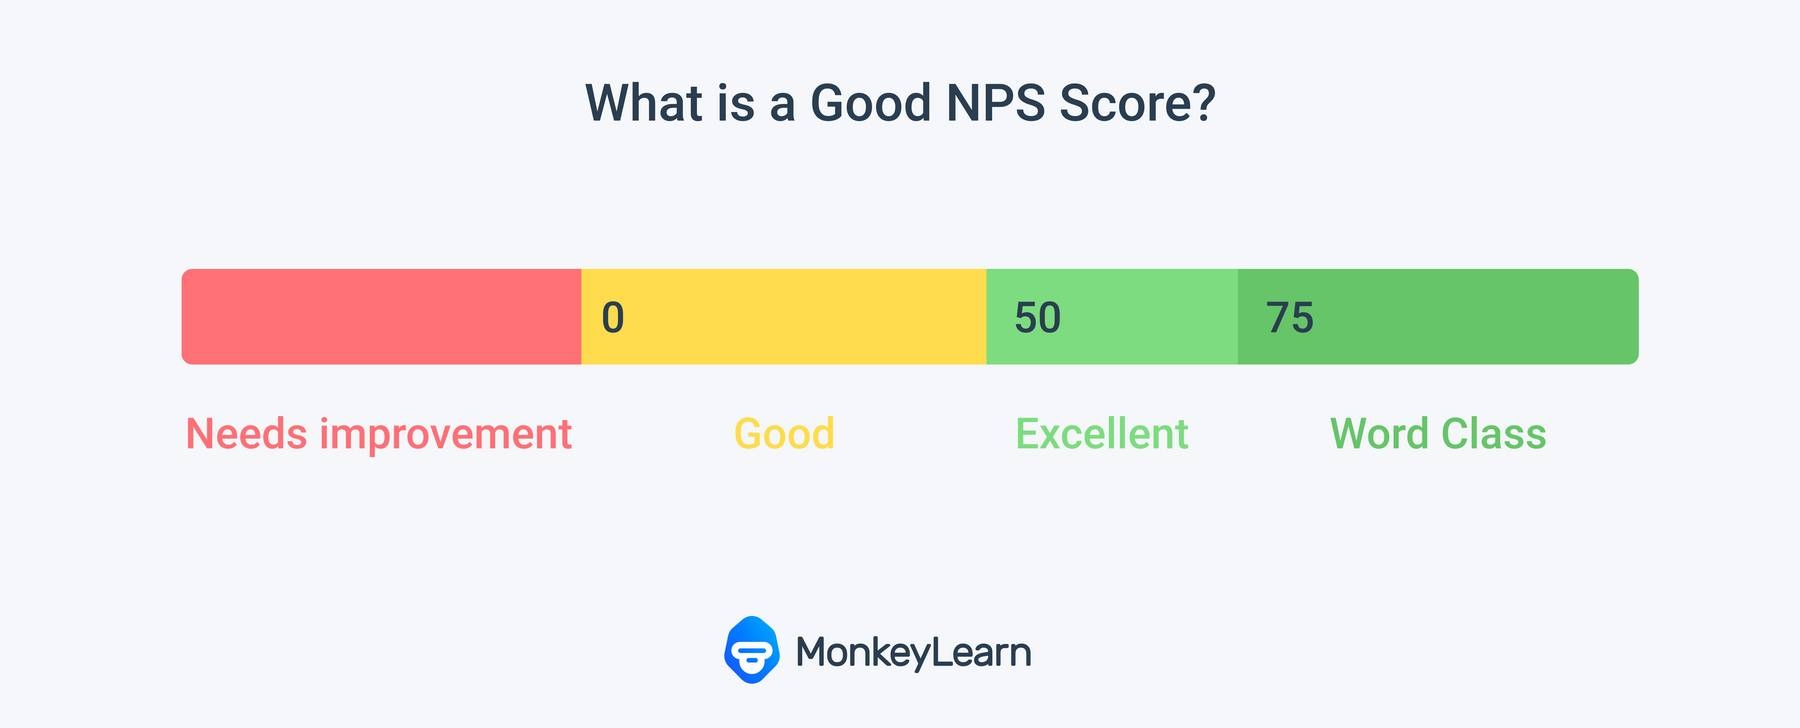
Figuring out whether your NPS score is good will depend to some extent on whether you choose to look at it using the absolute method or relative method.
An absolute perspective looks at an average benchmark across all industries. This gives less than 0 as needing improvement, under 50 as good, over 50 as excellent and anything over 75 as world-class.

A relative method looks at the benchmark specific to your industry. This can be useful, as NPS scores often vary greatly from industry to industry. By comparing your score against that of your competitors, you get a better idea of where you stand in the marketplace.

Overall, rather than fixating too much on external benchmarks, it’s a good idea to use your own score as your yard stick i.e. a benchmark to be improved upon. That way you are focused on improvement. To learn more about this, check out our blog post what is a Good NPS Score.
NPS is a dynamic metric with more survey data coming in frequently. This means that your score can change frequently, making it important to continually measure and adapt your NPS questions and approach.
How to Improve Your Net Promoter Score
Knowing your NPS is important, but it’s only a starting point. Once you have your number, chances are there will be some room for improvement.
To do this, you need to understand why your customers have given you the score they have. Knowing that allows you to tailor your efforts to fix specific things in exactly the way your customers need.
To gather more information you need to add an open-ended question after the main one. This question is usually:
“Give us the reason behind your score.”
But different questions can be asked to gather different kinds of data. This additional question gives you qualitative data that shows why your customer feels the way they do.
The data that you gather from your open-ended question is more difficult to analyze. When you analyze quantitative data, you are simply adding up numbers. However, when it comes to qualitative data you have to analyse feedback, emotions and more.
In the end, however, this extra question yields far more useful information and let’s you make data-driven improvements to your customer experience.
A solution to the challenge of analyzing all of this data is implementing automated survey analysis through machine learning.
Manually processing survey data is a labor-intensive task that leaves a lot of room for human error and subjectivity. Natural language processing (a subset of machine learning), on the other hand, is objective and efficient, giving you impartial, error-free results in real-time.
However, building a customer-made machine learning solution is an expensive process that requires a lot of time and technical know-how. MonkeyLearn can help you in a matter of days, with much lower costs.
MonkeyLearn is a no-code text analysis tool that uses machine learning to automatically analyze unstructured data. Using MonkeyLearn, you can sort your NPS open-ended answers into sentiment, topic, extract keywords, and more.
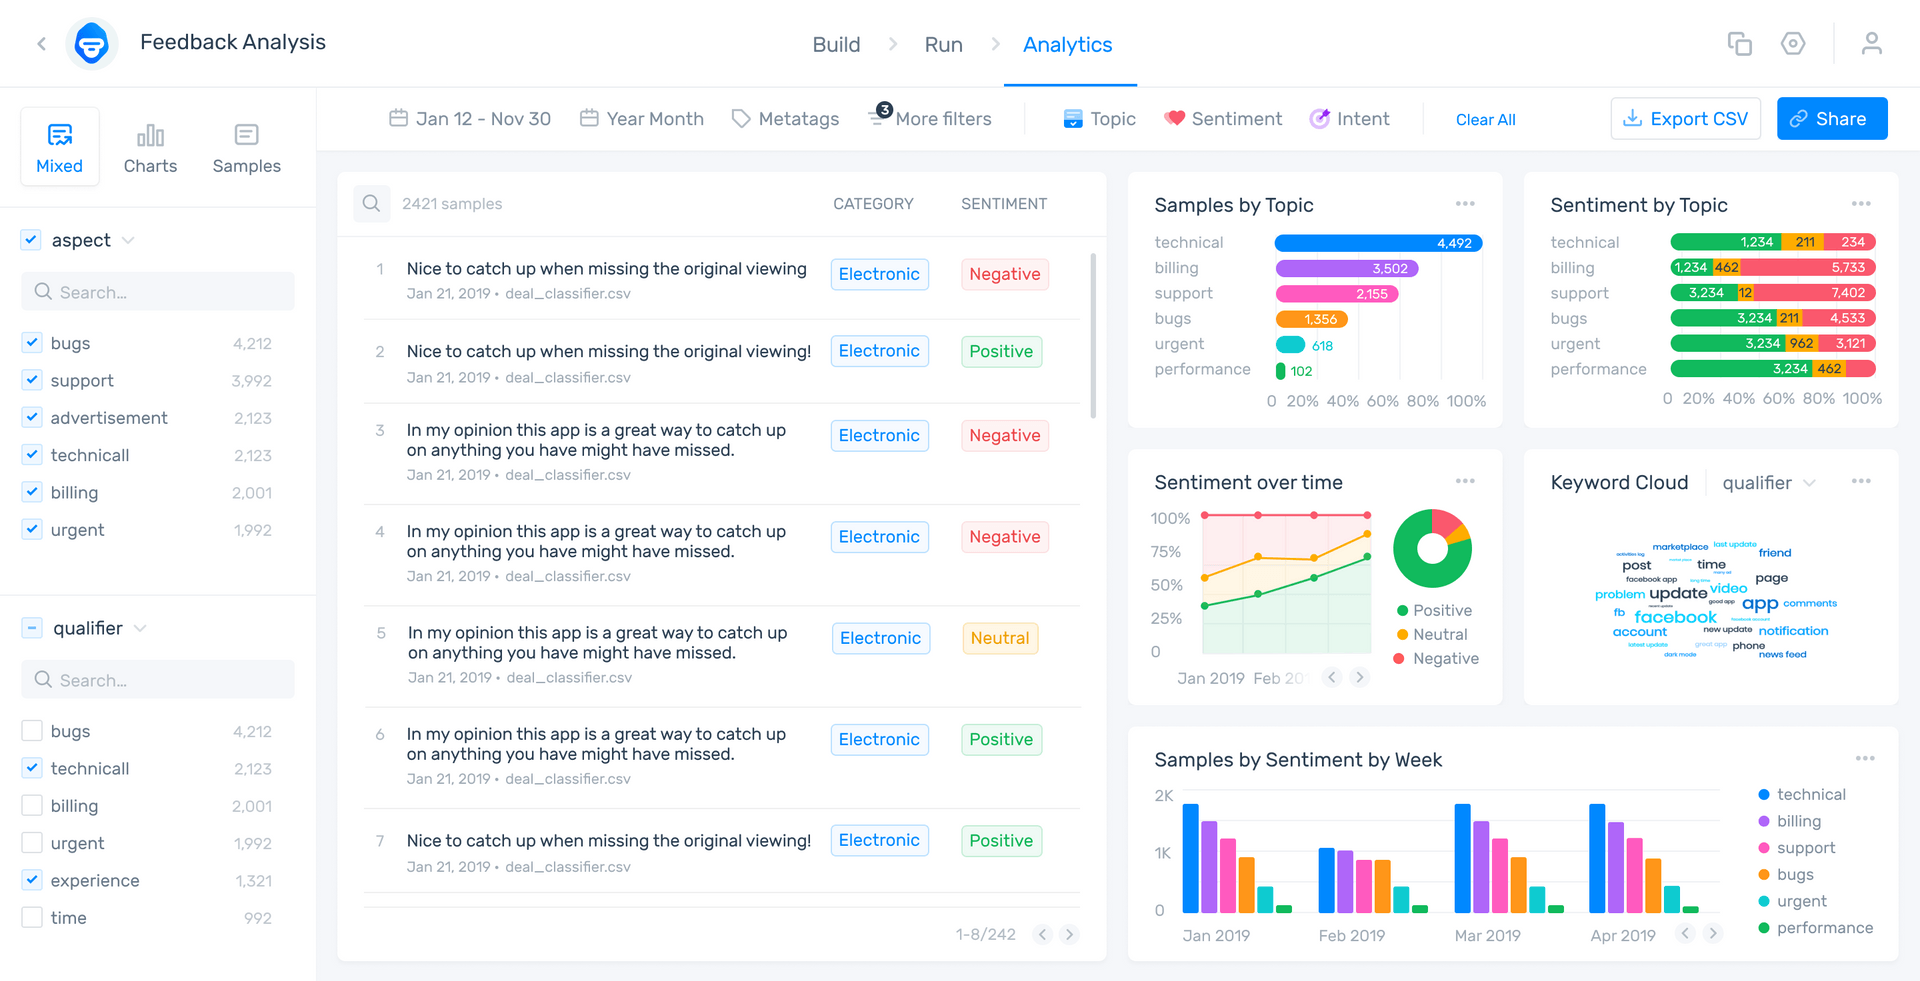
Then, you can visualize the results with MonkeyLearn Studio dashboard, which brings together all your findings in one handy place. Now, you can easily pick up any trends in your data, which is sorted into easy-to-digest insights.
Here’s an a public demo of the MonkeyLearn dashboard so that you can get an idea of its capacity (also pictured below):

Conclusion
NPS is the gold-standard metric CX that you can’t do without. It’s straightforward and easy for customers to complete and gives you a clear indication of how loyal your customers are. By adding in an open-ended question you can dig into the ‘why’ behind your score.
With these responses you can make meaningful changes to the customer experience and ultimately increase customer loyalty, turning detractors and passives into promoters in the process.
However, having the right automation tools working for you is the key to extracting actionable insights from the data you receive back.
Try out MonkeyLearn’s suite of tools today to see how you can get the most out of your NPS results.

Tobias Geisler Mesevage
July 22nd, 2021


