Top 10 Data Visualization Tools in 2022

We live in the age of data. Without it, your business can’t achieve its full potential. However, all the data in the world can’t help your business if you don’t understand what it means.
This is where data visualization comes into play. Data visualization tools take your data and serve it up to you in the form of charts, graphs and dashboards, unlocking easy-to-read insights.
One thing to keep in mind, however, is that for your visualizations to be valuable the unstructured data you are using needs to be accurately analyzed. So, data analysis and data visualization should always go hand in hand.
There are a lot of data visualization tools out there, and sifting through them can be a daunting task. In this guide we’ll take you through exactly what data visualization is, then go through ten of the best data visualization tools.
- What Is Data Visualization?
- Why Is Data Visualization Important?
- The Best Data Visualization Tools
- The Wrap Up
What Is Data Visualization?
Data visualization is the practice of transforming data into a visual representation, like in a graph, chart, or map. This makes it easier for the human brain to process the information, quickly detecting patterns and outliers in data.
Here are some of the most common data visualization techniques:
- Pie charts
- Word clouds
- Bar charts
- Gantt charts
- Line graphs
- Heatmaps
- Scatterplots
- Infographics
- Tables
Why Is Data Visualization Important?
Human beings can process images 60,000 times faster than text. Seeing data in a visual context helps us perceive insights, trends and identify problem areas much quicker than if they were looking at raw data.
Speed is crucial for success. So, if your data reveals any problems within your business, you need to be able to spot and resolve these issues quickly.
Since you don’t need to be a data scientist to interpret easy-to-digest visualizations, employees are able to use this information when making decisions — resulting in a more data-driven business.
Now that we know why data visualization software is important, let’s dive into some of the best data visualization tools out there.
The Best Data Visualization Tools for Businesses
Getting straight into it, here are our top ten best data visualization tools:
- MonkeyLearn Studio - All-in-one text analysis and data visualization
- Tableau - A popular and well established data visualization tool
- Excel - An entryway to the world of data visualization software
- Microsoft Power BI - Microsoft’s main datavis offering
- Sisense - Innovative functionality and handy features
- Zoho Analytics - A go-to tool for marketers and salespeople
- DataWrapper - Straightforward, code-free charts and maps
- Fusion Charts - Extensive options for visualizing your data
- Infogram - Experts in infographics, offering sleek designs
- Google Charts - A comprehensive and free DataViz tool
1. MonkeyLearn Studio
MonkeyLearn is the only all-in-one text analysis and data visualization software on the market. This means that you have your analysis and visualization in one easy-to-access place.
Our tools can process huge amounts of data, analyze it quickly using varied text analysis techniques and transform it into compelling visualizations that are easily viewed in the interactive Studio dashboard (pictured below). This is then updated in real-time as your data updates.
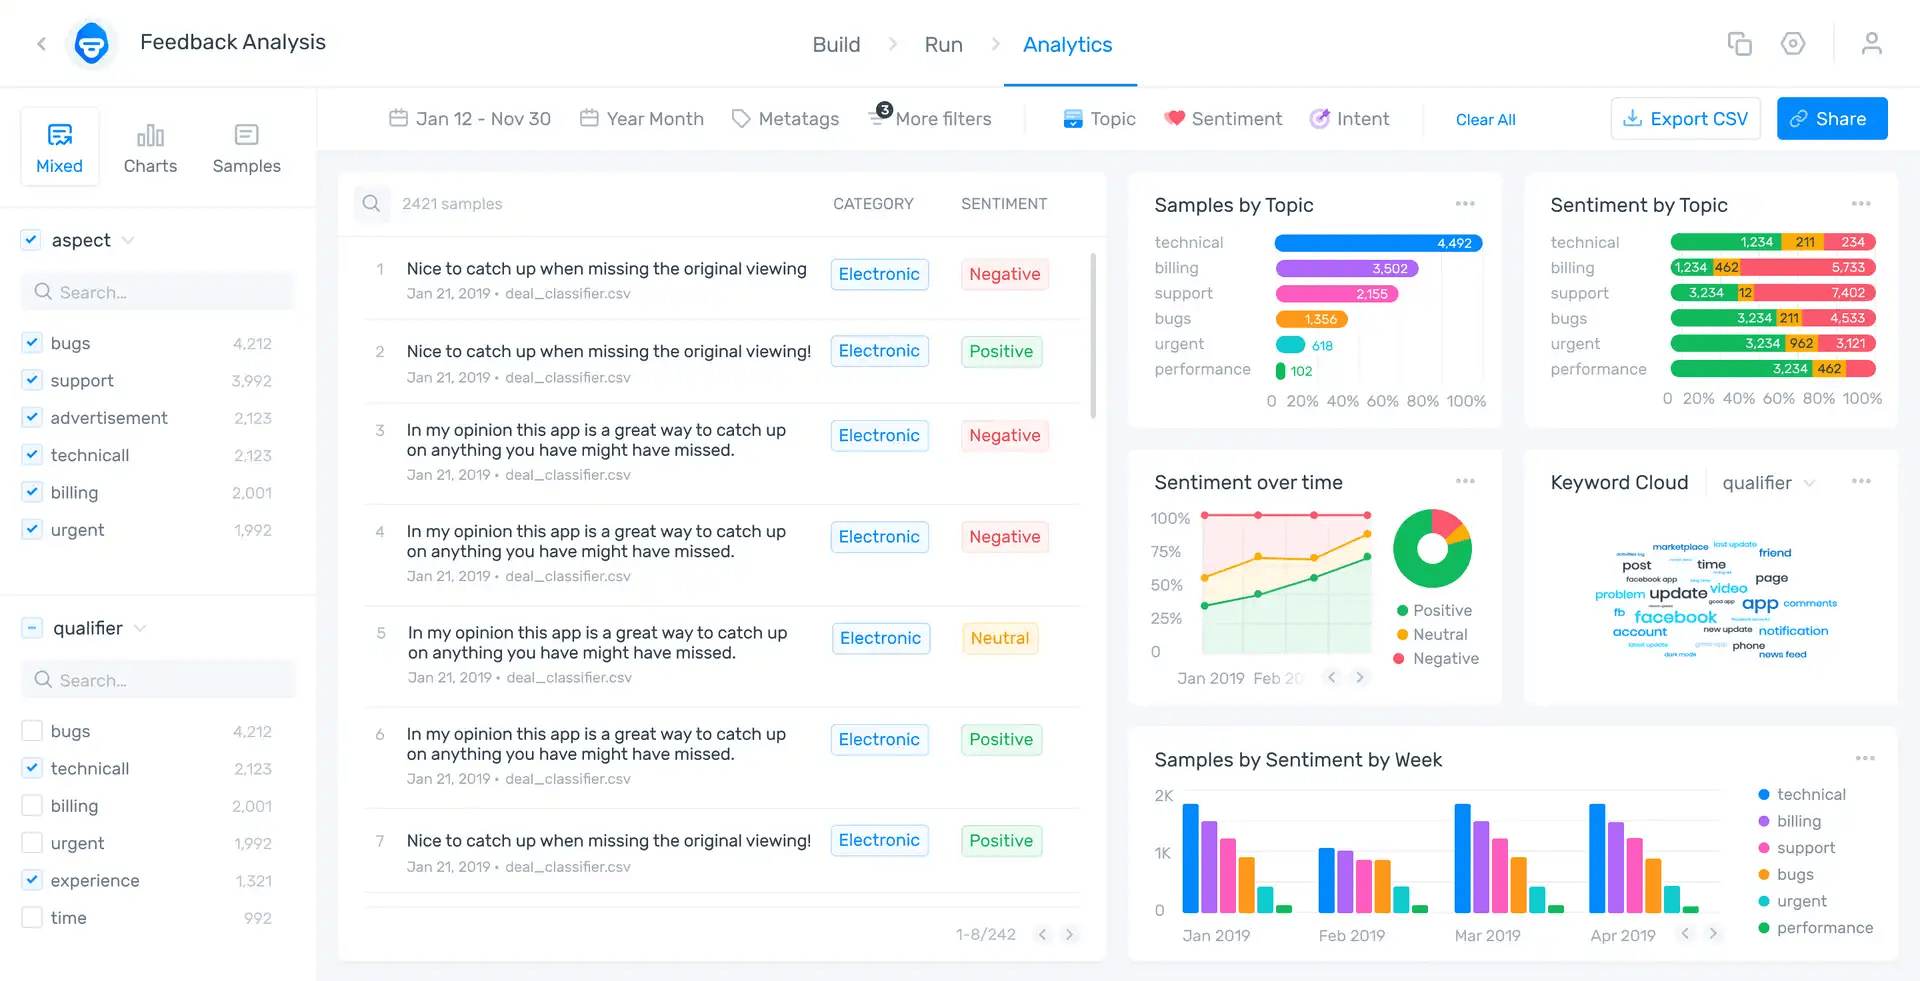
The no-code interface makes it easy for anyone to use, and our open-coding library gives the more technically-minded the freedom to customize. This means that it will suit both your data-experts and your data-novices.
A big strength of MonkeyLearn is that the data reflected in the visualizations is already prepped and accurate, thanks to our analysis tools. It also has complete and easily set up API integration, so you can use it with all your existing apps.
Learn more about our pricing and plans here
2. Tableau
Tableau is a popular datavis option, and for good reason. It’s powerful and the large amount of visualizations available range from simple to highly sophisticated.
Best for: Tableau can be used by pretty much anyone, from students through to corporates. However, it’s desktop version is especially popular with big corporations.
Strengths: Tableau’s strengths lie in its simplicity of use and the fact that it has many options for data visualizations and for data input. For example, you can integrate text analysis tools to do the analysis before visualizing your data. Another positive is that there’s a free version called Tableau Public.
Weakness: Within the free version, however, all of your visualizations are completely public. It also allows fewer data sources to be integrated as you can only upload from excel and manually.
Pricing: Tableau offers their free version and a number of other pricing plans.
3. Excel
Excel is obviously a spreadsheet tool but, although it wasn’t designed as a data visualization tool, it can behave like one. It comes with 20 or more built-in charts that include scatter plots, pie charts, radar charts, histograms and more.
Best for: Those who are just beginning to dip their toes in the datavis waters. Companies or individuals looking for a more advanced solution will need to look further.
Strengths: The biggest selling point for Excel is that you probably already have it and know how to use it.
Weakness: It does have its downsides though. It can’t process or analyze large amounts of unstructured data. It also doesn’t have an interactive dashboard.
Pricing: Excel can be purchased as a standalone or as part of Office 365.
4. Microsoft Power BI
This is where Microsoft Power BI picks up the slack. Unlike Excel, this software was created as a data visualization tool. As such provides classic data visualization tool elements like interactive dashboards and APIs for integration.
Best for: Those who use the Microsoft ecosystem and want a tool that fits nicely within that.
Strengths: Power BI has some big selling points. You can use the software to prep all your data for accuracy and you can choose from a wide range of visualizations.
It’s drag and drop features make it easy to use and it works well with Excel. If you are already familiar with Microsoft products, you’ll get up to speed with this tool quickly. It also has a lot of data connectors for pulling data from different apps.
Downside: It comes up short however, with large data sets. Processing masses of data requires a more premium option and more effort.
Pricing: They offer three different pricing plans, from the individual through to the organizational level.
5. Sisense
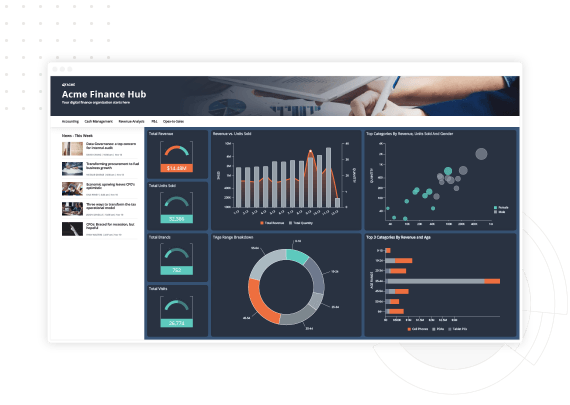
Sisense is a full stack analytics platform that comes in two parts: ElastiCube, their analytical database and the web interface. Like Power BI, Sisense comes with drag and drop features and is highly customizable.
Best for: Those who are well-versed in data and are looking for advanced features.
Strengths: What is great about Sisense is that it boasts the advanced functionality more commonly seen in mature software on the market, like Tableau. One of these features is in-chip processing which allows for faster, more efficient queries. These queries can also be made in natural language which work within apps like Skype and Slack.\
Weakness: For those who know what they are doing, Sisense is intuitive. However users need data knowledge to be able to use this system to its full potential.
Pricing: You can request a pricing estimate for Sisense here.
6. Zoho Analytics
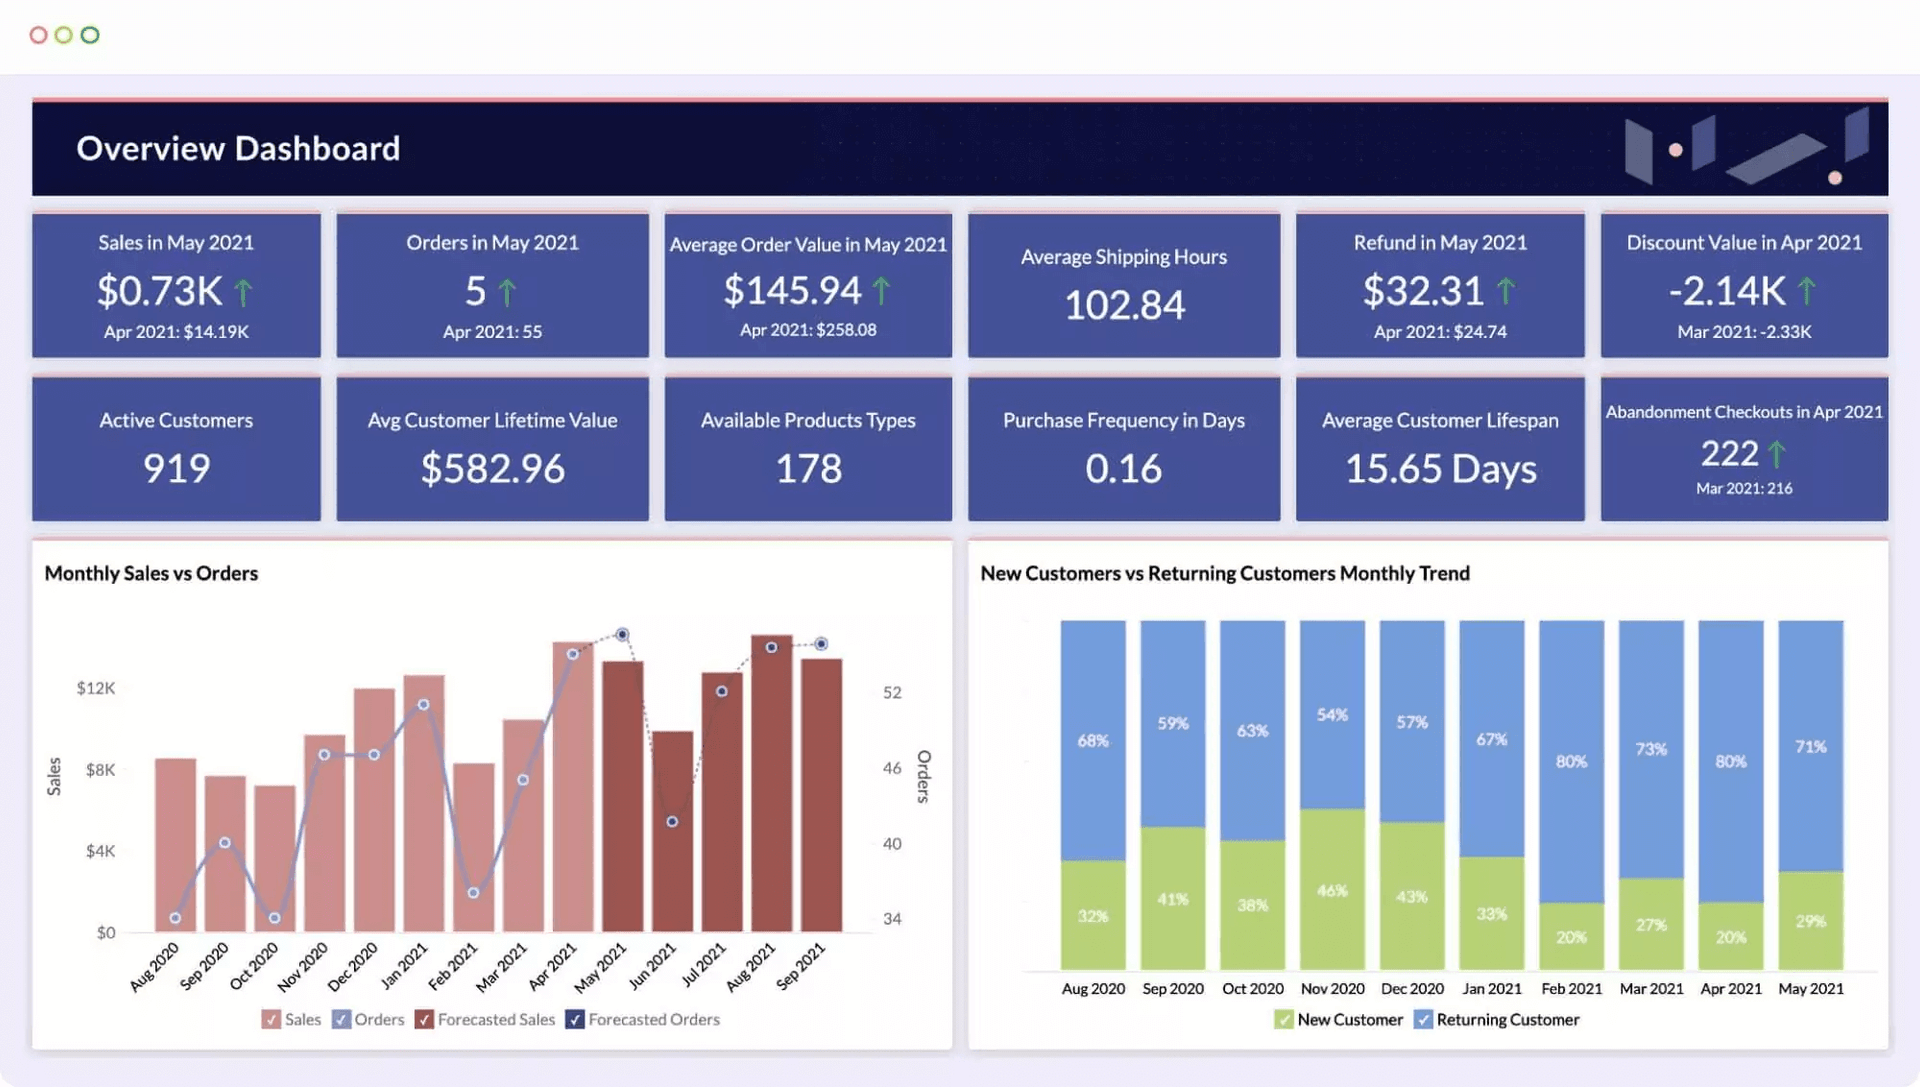
Zoho Analytics specializes in business intelligence visualizations. It offers a number of different ways to chart your data and varied dashboards. It also supports a number of different data connections and lets you prep your data within the platform.
Best for: Marketers and salespeople due to its strong BI focus.
Strengths: It comes with an AI assistant you can ask questions to in natural language. It also boasts an impressive amount of data connections. This means wherever your data is, you can transfer it to this software to visualize it. It’s drag and drop feature, which is common in most of our top ten, makes the dashboards user-friendly.
Weakness: However, you do need some kind of knowledge of data visualization experience for the initial set-up. This is probably not the tool for you if this is your first foray into the datavis world, or if you don’t have someone else to set it up for you.
Pricing: They do have both a free and paid version if you want to try before you buy.
7. Datawrapper
Datawrapper began specifically for the news industry, but they now service a wide range of industries. The three kinds of visualizations it supports are maps, charts and tables. Within these they offer lots of different options.
Best for: Those looking for a simple, code-free data visualization tool.
Strengths: The strength of this tool lies in its simplicity. You don’t need any coding to be able to use this tool, which makes it friendly for beginners. Another plus is that once their charts are embedded on your site, for instance, they are live and can update as your data changes. This is however a feature that you’ll find in software like Tableau and all established tools.
Weakness: Unfortunately you can only manually upload your data. This lack of data source integration makes their offering limited compared to other big hitters.
Pricing: They offer a free, individual and organizational version.
8. FusionCharts
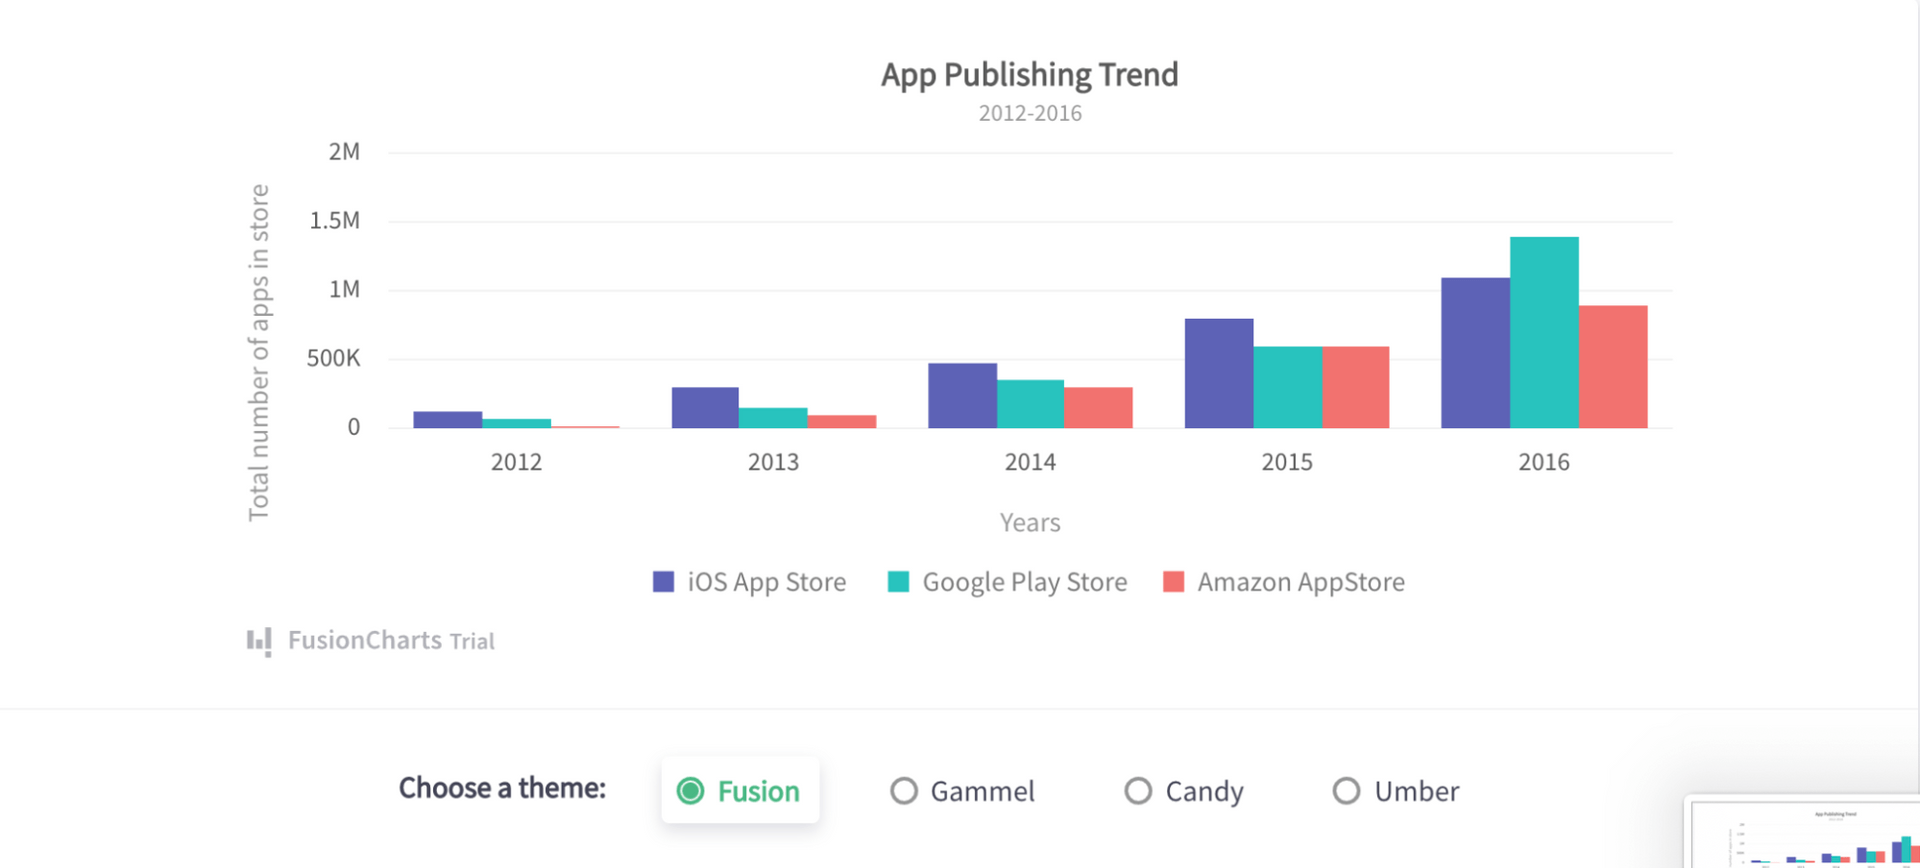
FusionCharts is a tool that offers over 100 interactive charts and over 2,000 maps. This choice is what sets it apart from other tools. It also integrates with a number of platforms making it flexible and accessible.
Best for: People looking for countless options for maps and charts.
Strengths: A big bonus is that it already has a number of pre-set templates so rather than coding your own, you can just choose from one of theirs.
Weakness: However, as it’s based in javascript you do have to have a knowledge of this language to make the most out of it. This could be a potential drawback.
Pricing: They offer four different pricing options.
9. Infogram
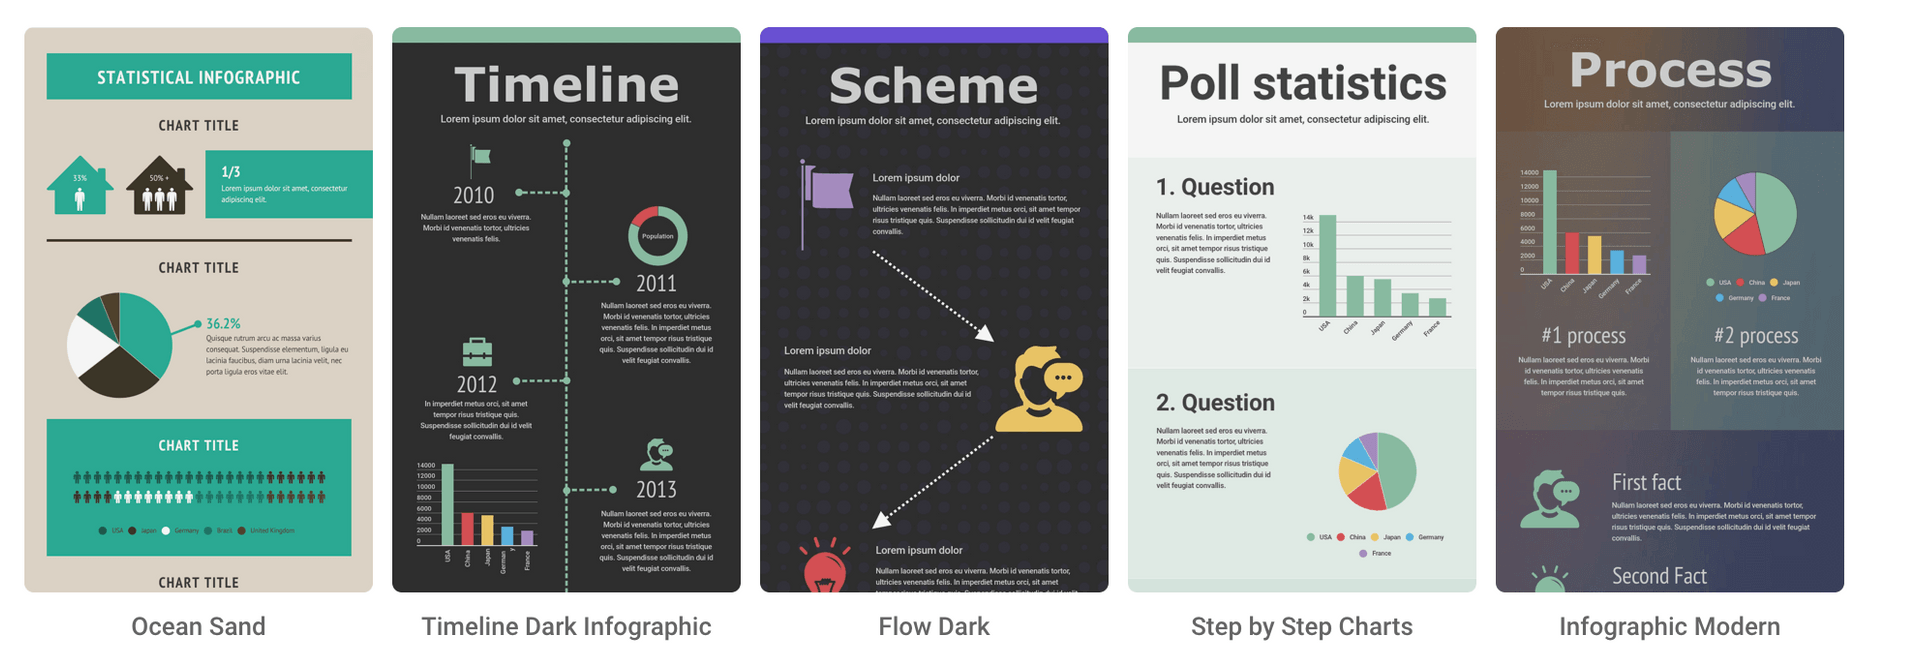
Infogram is a popular option for creating reports, charts and maps. They offer over 550 maps and 35 interactive charts. It’s strength, and where it differentiates itself from other data visualization tools, is with infographics.
Best for: Users who are looking to display their data in attractive infographics.
Strengths: It has an easy-to-use interface and the data visualizations are straightforward and easy to learn. Another plus is that they offer many different templates with aesthetically pleasing designs.
Weakness: The downside, and one that many of the tools listed face, is that it’s not an all-in-one solution. You have to link it to an analytics platform to make sure that the data you're working with is prepped and accurate.
Pricing: They offer everything from a free to a premium option.
10. Google Charts
Finally we have Google Charts which lets you create interactive charts which include maps, bar charts, histograms and more. You can then embed these online and run them live.
Best for: Those who already use Google Workspace and want to integrate with many data sources.
Strengths: It is compatible with SQL databases, which means you can use large data sets like in other more premium tools. It also has a number of data connectors for you to collect your data.
Weakness: However, to use it, you do need to know how to code. This could be a big barrier when it comes to getting your people to use it.
Pricing: Google Charts is completely free.
The Wrap Up
With so many products on the market, it’s hard to choose the data visualization tool right for you. What you need will depend to a large extent on who is going to be using this tool.
An all-in-one tool like MonkeyLearn Studio, which combines both data analysis and data visualization, is an efficient and effective solution that suits both tech-savvy employees and the less so.
It also allows you to perform your data analysis before you visualize your data, making sure that the insights you are visualizing are accurate.
Sign up for your free demo today and see how MonkeyLearn can transform your data analysis and data visualization.

Inés Roldós
August 20th, 2021


