

How to Analyze Data: Steps Toward Better Business Decisions in 2022


Businesses are overwhelmed with data, which means it often goes ignored.
Granted, it can be hard to sort through huge amounts of data, especially if you don’t have the time and resources.
However, with the right tools and processes, you can start putting your data to use in next to no time – and with minimum manual input.
Through data analysis techniques, you can gain valuable insights that inform overall decision making and help you better understand your customers’ needs.
Start analyzing your data
Below, follow 5 steps in the data analysis process and learn how easy it is to transform your data into meaningful insights.
How to Analyze Data in 5 Steps
To improve how you analyze your data, follow these steps in the data analysis process:
- Step 1: Define your goals
- Step 2: Decide how to measure goals
- Step 3: Collect your data
- Step 4: Analyze your data
- Step 5: Visualize and interpret results
Step 1: Define Your Goals
Before jumping into your data analysis, make sure to define a clear set of goals. What do you want to obtain from data? What’s the problem or situation that you are trying to solve or understand? Knowing this will help you identify what data you’ll need to collect (and what type of analysis you’ll need to perform).
Design your questions around a specific problem and possible solutions.
For example, if you see a sudden spike in low CSAT scores that are related to a question you asked about customer support, you might ask the following questions to solve the problem.
Goal: improve customer support
- Why are customers unhappy with our support team?
- How can we improve customer service?
Step 2: Decide How to Measure Goals
Once you’ve defined your goals, you’ll need to decide how to measure them.
For example, if you want to measure individual support agent performance, you might dig into the numerical data to find out how long it takes each agent on average to respond to a customer. Then, measure each agent’s performance against the overall average.
If you want to know why customers are unhappy with your level of customer service, however, you’ll need to look at your qualitative data.
Perhaps a particular customer support agent is mentioned more often than others – but are they mentioned in a positive or negative way? You might also want to look at specific topics mentioned, for example response times or if customers were happy with how their issue was resolved.
Step 3: Collect your Data
Now that you know what your goals are and how you want to measure them, you can start collecting the correct type of data. While it’s best practice to collect both quantitative and qualitative data, you’ll also need to collect data that’s relevant to the questions you're trying to answer.
Quantitative data: structured data that can be quantified and measured. For example, tags and numerical data,
Qualitative data: unstructured data that needs to be structured before mining it for insights. For example, text, speech, images, videos.
Quantitative data is often stored in databases or Excel sheets, ready for you to analyze. But, where can you find qualitative data?
Here are a few examples of qualitative data:
- Emails from your customers
- Customer support tickets
- Chat conversations
- Online product reviews
- Social media data
- Open-ended survey responses
Most of this data will be stored in the tools you use on a daily basis, like Zendesk, Gmail, and social media management platforms. Some of it you may need to gather using web scraping tools (if the data lives on websites, blogs, or forums).
Keep in mind that the success of your data analysis depends heavily on the quality of your data, so take the time to prepare your data, by removing noise and unnecessary characters, HTML elements, and punctuation marks, which usually appear in unstructured text data.
And remember, use relevant data sets. For example, if you want to analyze customer sentiment around customer support, then you’ll need a dataset that contains opinions about customer support.
Step 4: Analyze Your Data
Data analysis tools, like Excel, Google Sheets, and Airtable, and business intelligence tools, like Tableau and Google Data Studio, are excellent for crunching numbers. They allow you to plug in your quantitative data and create comprehensive visualizations, charts, and graphs.
These tools are great for getting started with data analysis, but there are more complex data analysis methods that you can use to go even deeper with your analysis.
Choose your data analysis method:
- Inferential Analysis – statistical data analysis to discover patterns and trends
- Text Analysis – real-time qualitative data analysis
- Diagnostic Analysis – exploratory quantitative and qualitative data analysis
- Predictive Analysis – historical quantitative and qualitative data analysis
- Prescriptive Analysis – scenario-based quantitative and qualitative data analysis
Some of these data analysis methods use AI and machine learning to help you automatically analyze large sets of unstructured data. But don’t let that put you off. There are many out-of-the-box tools that come with pre-trained machine learning models so you can get powerful insights in just minutes, without writing a single line of code.
A pre-trained keyword extractor, for example, can quickly summarize your data by pulling out the most frequent words in your data. Sentiment analysis, on the other hand, automatically classifies your data into positive, negative, and neutral. When combined, you can start to gain deep insights from your data, like negative and positive trending topics.
Try out this pre-trained sentiment analysis model to see how easy it is to extract insights from qualitative data:
Try out this ready-to-use sentiment analysis model to see how easy it is to extract insights from qualitative data:
If your data requires a more customized approach, you can build your own no-code text analysis tools, using an intuitive tool like MonkeyLearn.
Once you’ve trained your model using your business data and criteria, you can connect it to the tools you love through the MonkeyLearn API or integrations (like Excel, Google Sheets, and Zendesk), and start gaining value from data in real-time.
Step 5: Visualize & Interpret Results
Now for the fun part. Transform your data analysis into striking data visualizations using data visualization tools, which help summarize your data so you can easily spot trends, patterns, and relationships in your data. They’re also a great way to back up business decisions and present your findings to the rest of the team.
Data Visualization Tools
- MonkeyLearn Studio: combines in-app data visualization with text analysis tools, creating a powerful all-in-one data analysis solution.
Take a look at the dashboard, which shows sentiment around different topics.


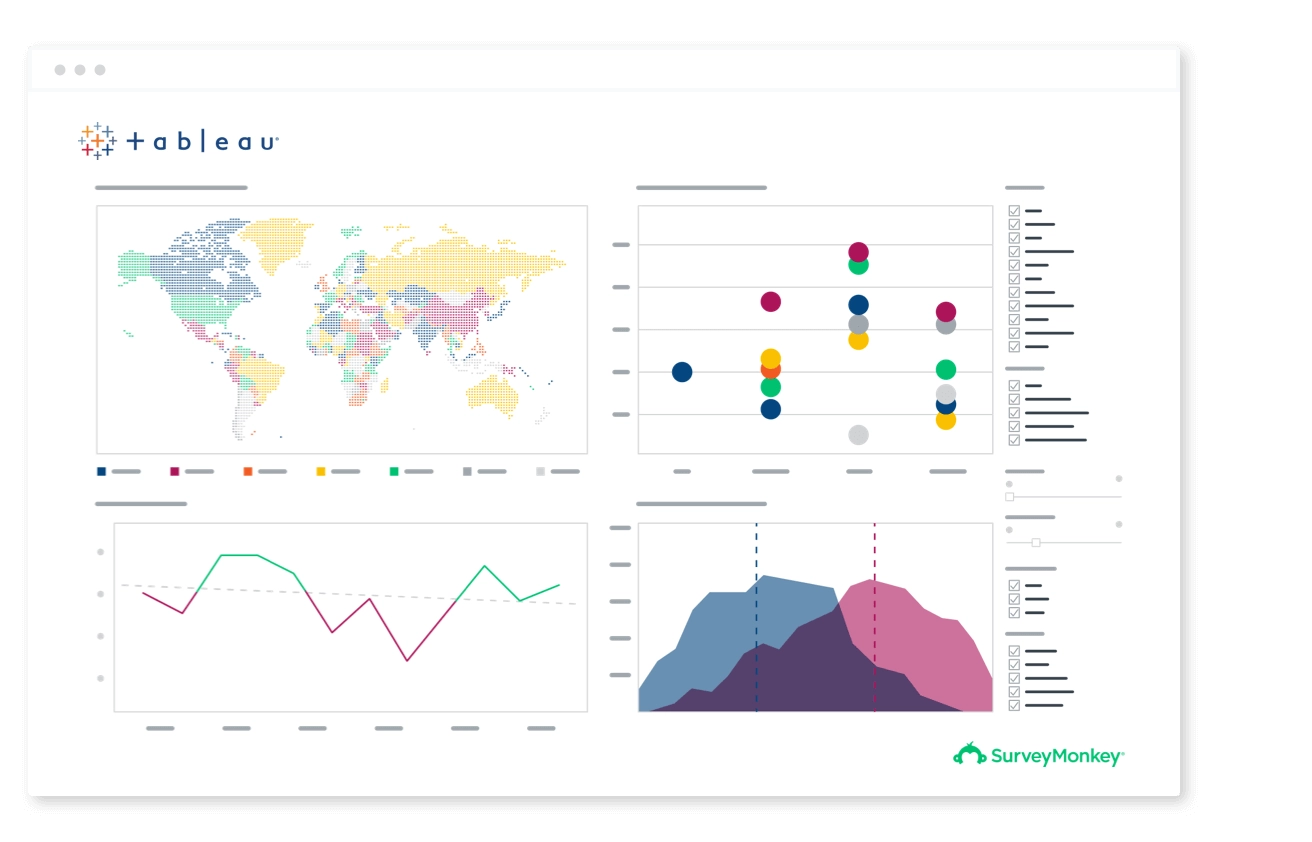
- Tableau: visual analytics software with an easy-to-use drag and drop interface.

- Google Data Studio: for a simple data visualization tool that’s free to use.


Once you’ve visualized your data, start making decisions that help you reach your business goals.
Get Started with Data Analysis
Analyzing data allows companies to learn what’s working well for them and what to improve in order to grow.
Businesses have been taking advantage of quantitative data for a long time now, but there are so many more insights you can gain from qualitative data. While you’ll need to spend more time preparing this type of data, the steps involved in analyzing qualitative data are the same.
Also, the analysis itself is easier, faster, and more accurate, thanks to text analysis tools. By combining both quantitative and qualitative data analysis, businesses can spot trends and truly begin to listen to the voice of their customers.
Use everyday tools, like Excel, to analyze your data and understand what’s happening.
Then power up your data analysis with AI machine learning tools, like MonkeyLearn, to understand why numbers and curves are trending up or down.
Sign up for a free demo to see how easy it is to perform a deep analysis of your data.


Inés Roldós
September 17th, 2020
Posts you might like...


Text Analysis with Machine Learning
Turn tweets, emails, documents, webpages and more into actionable data. Automate business processes and save hours of manual data processing.
Try MonkeyLearn


