Data Analysis - Top Methods & Techniques for 2022

Regular data analysis is, of course, important to every business. But the kinds of analyses you run and the kinds of techniques you use will always affect the results you get. And before you even begin, this all depends on the kinds of data you have access to and the tools you want to put to use.
Let’s take a look at what data analysis is, broadly. Then we’ll go over the major data analysis methods and how to put machine learning data analyses to work for your business.
What is Data Analysis?
Data analysis is the process of collecting, cleaning, analyzing, and visualizing data with various investigative methods, analytics software, and business intelligence tools to find patterns, discover insights, and make data-driven decisions.
There are a variety of analysis techniques you can use on all kinds of data about your company, your competition, and your customers to go from raw data to useful statistics, informed conclusions, and predictive results.
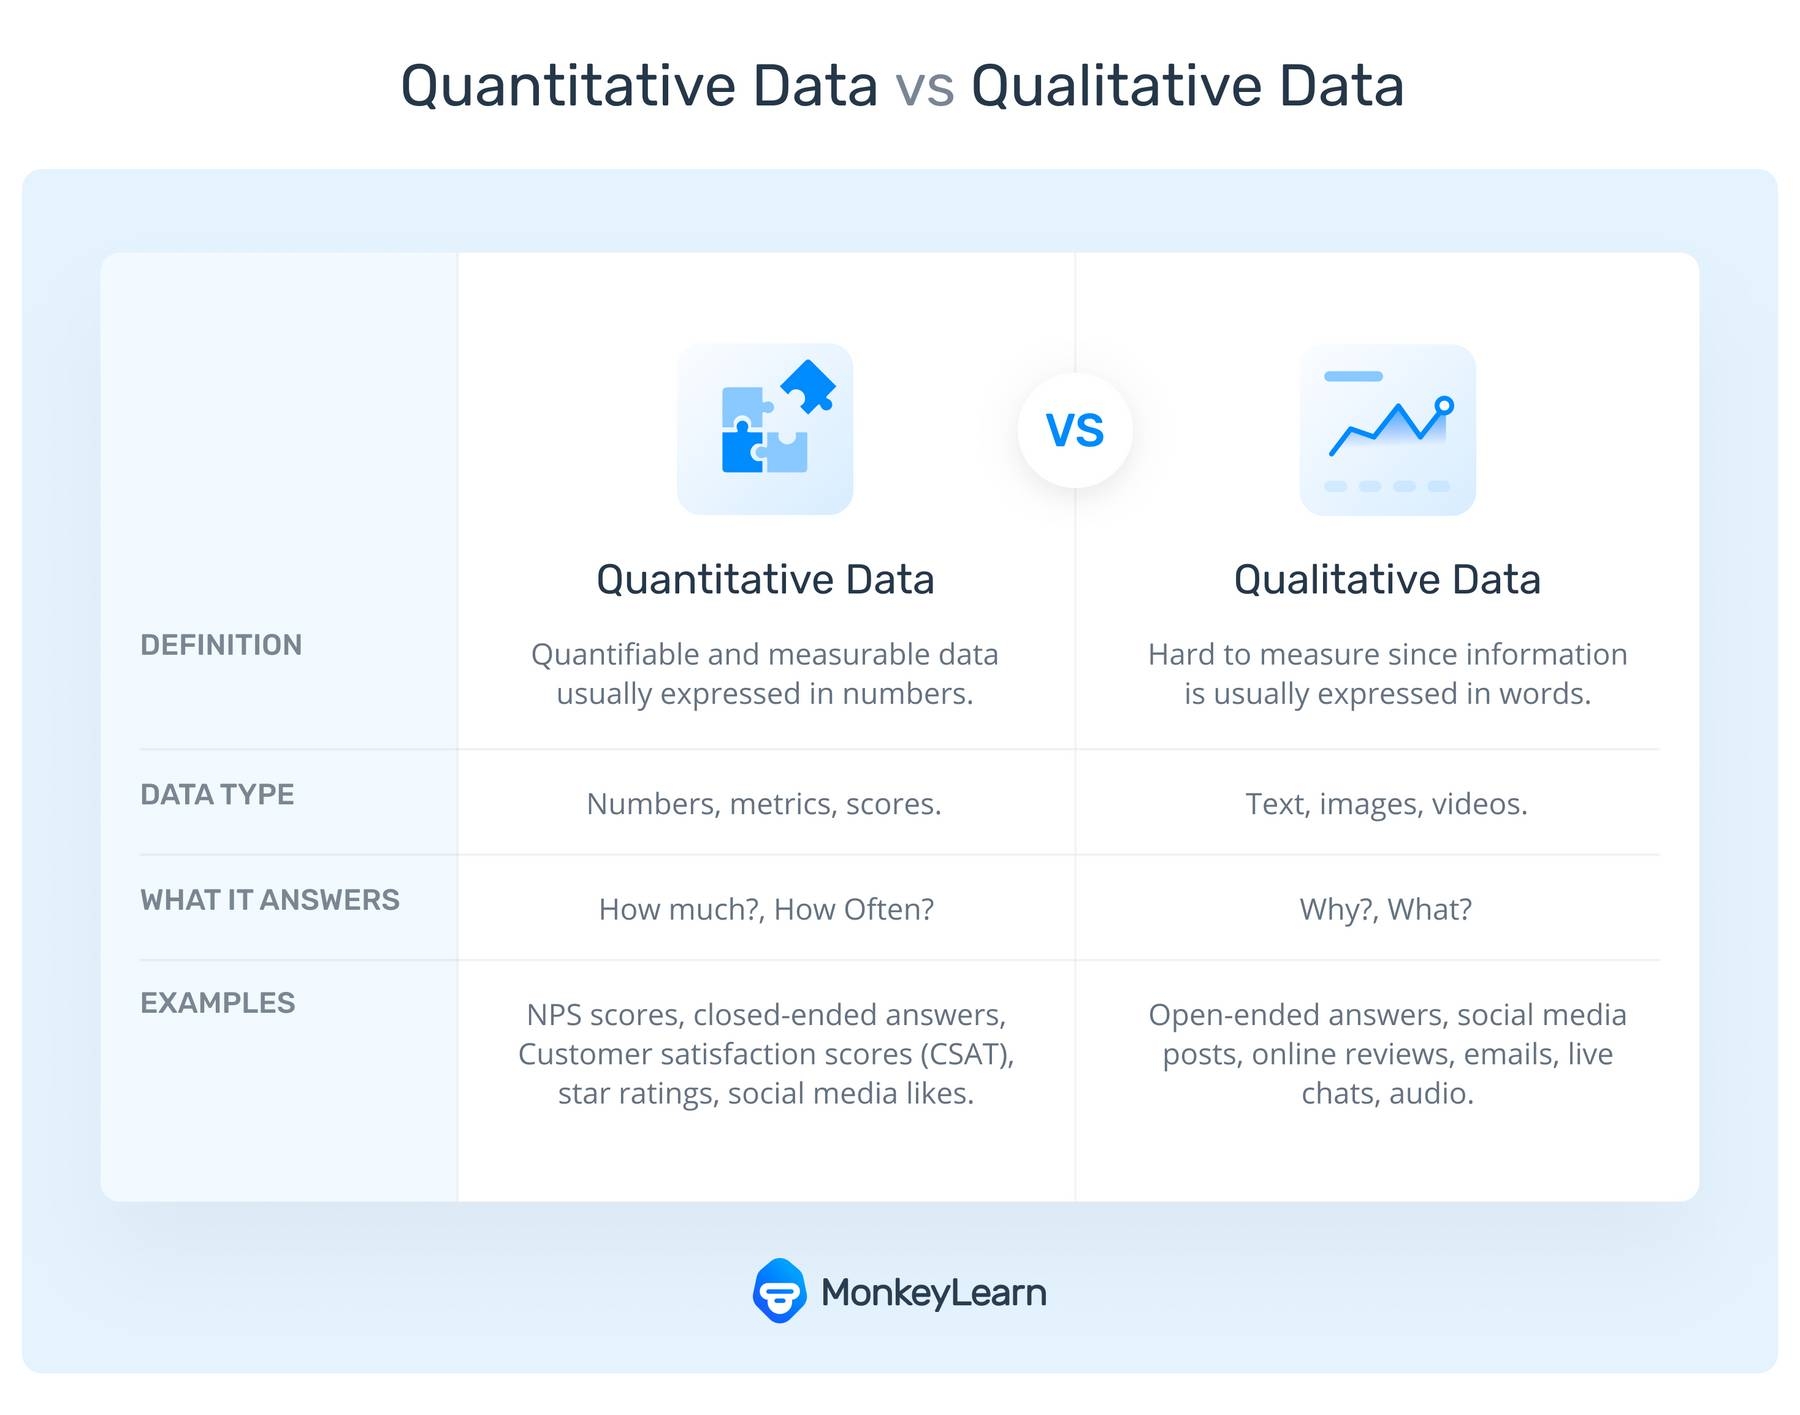
When you’re considering different data analyses, you need to decide which data you want to analyze: qualitative data or quantitative data.

Quantitative data is just what it sounds like – quantifiable data of whole numbers, statistics, and percentages – numerical data. Quantitative data is generally structured data that comes pre-formatted and organizes easily into spreadsheets or structured databases.
Quantitative data analysis is easy to do because it’s generally a pretty straightforward calculation and can offer some impressive results to find out “what happened,” like the percentage of customers of a certain demographic that have purchased a certain product.
Qualitative data, on the other hand, is unstructured data that’s a bit more difficult to analyze because it first needs to be structured in a way that machines can understand. Qualitative data analysis can offer much more detailed results, however, because it deals with features and characteristics – descriptive data that’s often expressed as open text.
Qualitative data goes beyond “what happened” to uncover “why it happened” or even “what might happen next.” It deals with opinions, feelings, and emotions, so it can be much more useful for understanding customer satisfaction, uncovering specific customer journey pain points, and gauging overall brand sentiment.
8 Top Data Analysis Methods & Techniques
Here are some of the most important data analysis processes and methods for both quantitative and qualitative data analysis.
- Sentiment Analysis
- Regression analysis
- Predictive analysis
- Monte Carlo simulation
- Cohort analysis
- Churn analysis
- Cluster analysis
- Time series analysis
Sentiment Analysis
Sentiment analysis is a data analysis technique that uses machine learning to automatically classify textas Positive, Neutral, or Negative.
Sentiment analysis is frequently used to analyze customer surveys and all manner of customer feedback. Try out this pre-trained sentiment analyzer to see how it works:
Once properly trained to the criteria and language of your business, custom-created sentiment analyzers can read thousands of pieces of text in just minutes to understand the feelings and emotions behind the comments.
You can even take your data analysis one step further with aspect-based sentiment analysis, to first classify your customer feedback by category or aspect – like Onboarding, Features, Shipping, Support, etc. – then sentiment analyze them, so you understand which aspects of your business or product are particularly positive and which are negative.

Regression analysis
Regression analysis calculates statistical probability by calculating the relationships between a dependent variable (the “outcome variable”) and other independent variables (called “covariates,” “predictors,” or “features”). The dependent variable is the characteristic you’re trying to make sense of or predict, and the independent variables are factors that could have possible influence over the outcome.
If you’re trying to calculate future sales or understand the sales of a previous time period, for example, independent variables that you might consider could be weather, time of year, new product releases from your competition, marketing campaigns, etc. Because regression analysis is statistical, it mainly deals with quantitative data.
Predictive analysis
Predictive analysis uses past data to forecast or theorize about future events. In sales, predictive analysis uses quantitative data, like past sales, demographics, and CSAT and Net Promoter Scores. If a certain demographic is aging into different interests or increasing their income, this could affect the products or services they choose.
But it can go into deeper analysis with open-ended survey question analysis and social media sentiment analysis to understand “why” customers make the choices they do and predict what is likely to happen in the future based on the feelings and emotions of customers. Predictive analysis uses qualitative data to help forecast how customers may react to different possible marketing campaigns, for example, using their opinions and feelings about current or past marketing.
Monte Carlo simulation
Monte Carlo simulation is a form of risk analysis that uses mostly quantitative data to attempt to calculate for all possible outcomes given previous outcomes, pre-existing data, and possible future decisions. It aims to calculate the range of outcomes – from extremely positive to extremely negative – in order to decide whether a given business (or other) decision is worth the risk.
A Monte Carlo simulation builds models of possible outcomes – which could go into the hundreds of thousands – by constantly changing the “probability distribution” for factors within the model that are not certain or will not be certain in the future.
Cohort analysis
Cohort analysis is a form of behavioral analytics that breaks data into datasets of related groups. This is used in sales to break customers into demographic cohorts, oftentimes the more specific the better, in order to analyze past buying habits to predict how they may act in the future. Depending on the analysis there could be dozens or thousands of cohorts, sometimes with individual customers fitting into many different categories.
There are many different theories on how best to divide customers into cohorts, allowing for very specific targeted cross-sections. Some will be obvious – by product, product feature, use case, etc. But some may be harder to pin down, like marketing cohorts that segment customers by multiple factors, like location, age, income, etc.
Churn analysis
Customer churn or employee churn (or attrition rate) is the loss of a business’s customers or employees. Churn analysis may use all of the above techniques to understand why employees and customers are leaving your company and try to predict what you can do to decrease churn and increase retention.
Churn analysis uses survey results analysis and a closed-loop feedback process, among other techniques, to understand why your customers or employees are unhappy, what you can do to better their circumstances, and what you need to do to improve communication with them.
Cluster analysis
Cluster analysis uses iterative algorithms to cluster data into non-overlapping subgroups within a dataset. Clustering algorithms are used in pattern recognition, machine learning, and image analysis, among others, to group similar information and classify it, either by trial and error or into predetermined groups.
Machine learning cluster analysis uses supervised learning to train algorithms to recognize similar data so that it can, ultimately, be automatically classified by the appropriate tag. This can be seen in the aspect-based sentiment analysis above where topic analyzers are trained to group text by topic or aspect.
Time series analysis
Time series analysis uses measurements or data points that are recorded (in lists, on graphs, etc.) as they occur, over equally spaced time increments. Examples of time series measurements are high/low tide, amount of rain, currency exchange rates, etc. Time series data is used to predict what is likely to happen in the future (at a given moment in time) by comparing it to previous events in the time series.
Now that you understand some of the top data analysis techniques and methods – let’s see how you can put them to work with data analysis tools and machine learning text analysis!
Data Analysis Process
Just 6 steps to major insights.
Define goals
What outcomes are you looking for and what techniques might you need to use? Are you looking to do a cursory quantitative analysis of sales numbers by quarter, for example, and compare it to your competition? Or do you need to dig into quantitative data with surveys targeted to specific demographics on your website or app?
Do you want to target overall brand sentiment, find new use cases for a product, or launch a new feature? Not only will your goals decide what kind of data analysis tools you need, but they’ll also dictate the kind of data you need to gather.
MonkeyLearn is a SaaS text analysis platform that incorporates some of the data analysis methods above to collect, clean, and analyze data with machine learning AI technology, so you can get more from your data, without the tedium and pain of manual analysis.
With MonkeyLearn you can get powerful, real-time results from data from internal CRM systems, emails, chatbots, online reviews, social media, and all over the internet.
If you’re working with quantitative data, on the other hand, spreadsheets, like Google Sheets and Excel are great options for data analysis, because you simply need to plug in formulas to execute all manner of calculations you may need: percentages, averages, maximum, minimum, mean, etc.
Collect data
You may already be collecting and storing much of the data you’ll need from internal sources, like CRM systems (Hubspot, Salesforce), help desk software (Zendesk, Freshdesk, Helpscout), email, chatbots, project management tools, and more. MonkeyLearn’s integrations allow you to connect directly to many of these tools, to collect data that’s nearly ready for analysis. Or most offer options to download CSV or Excel files.
You can also use web scraping tools to extract data from social media, online reviews, news reviews, and all over the web. Or there are a number of other MonkeyLearn tutorials to walk you through the process of data collection in just a few steps. Many sites, like Facebook and Twitter, even offer APIs to help you connect directly to their data.
Clean data
When you’re working with unstructured, open-ended data, it often comes with a lot of “noise,” or irrelevant data, like emojis and symbols, URLs, misspellings, and more, that will affect your analysis, so you first have to clean your data.
If you’re working with CSV files, you can do things like correct spelling, remove abbreviations, and apply lowercase to all your text to get started with cleaning.
MonkeyLearn’s boilerplate extractor, for example, removes HTML and other elements from text, and the email cleaner removes signatures, introductions, and other irrelevant text, so you’re left with only the last reply.
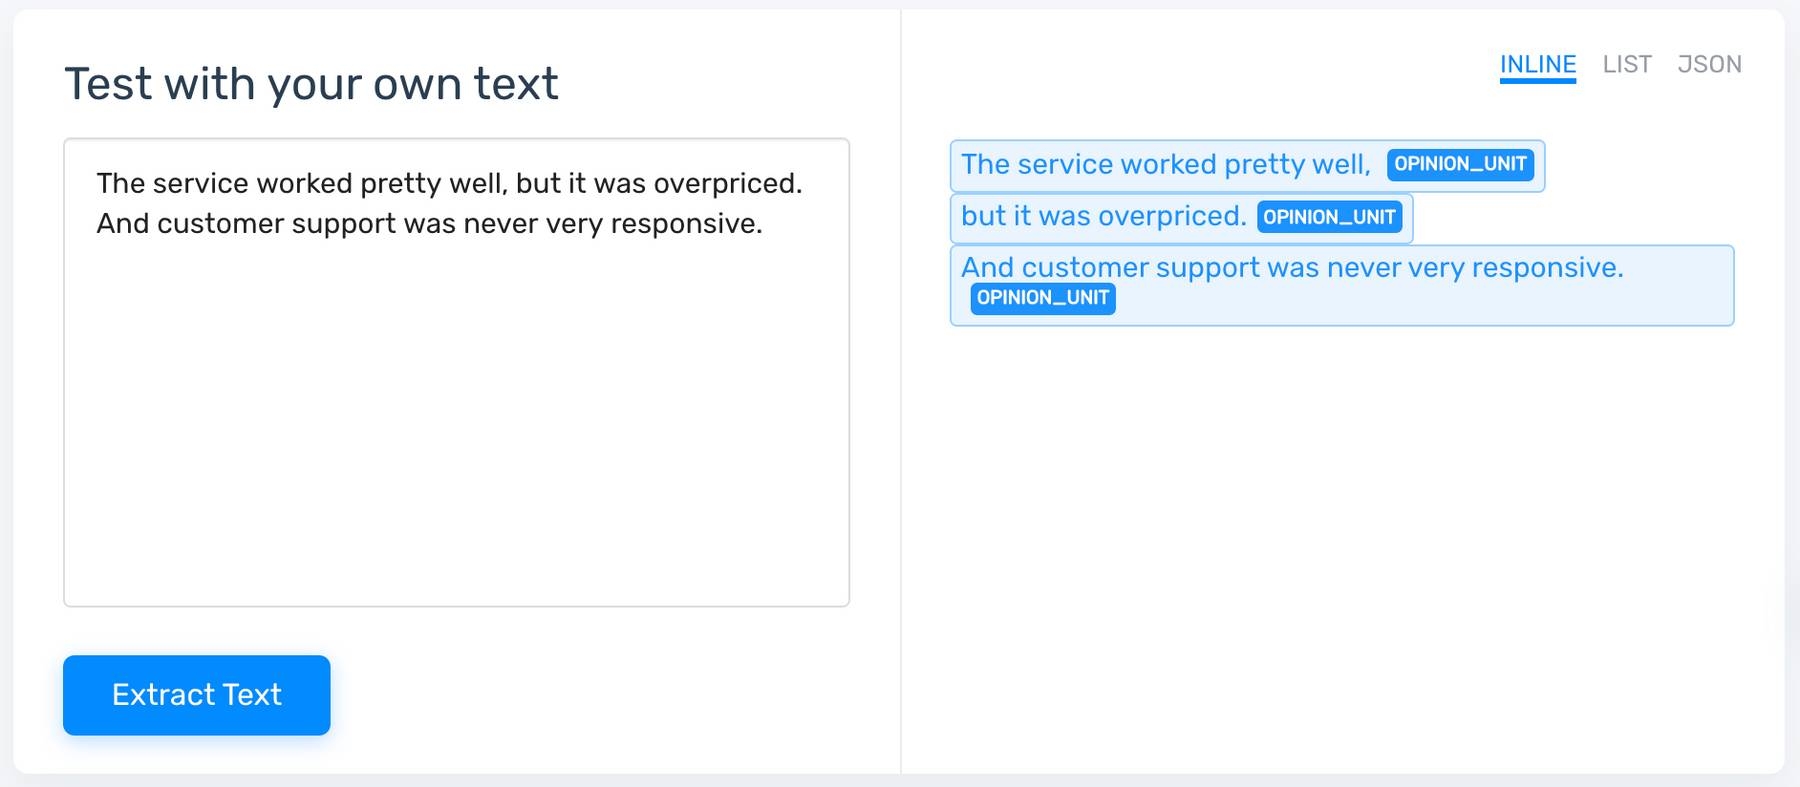
Finally, a single comment, sentence, or piece of text may contain multiple statements, even conflicting ideas, so you’ll need to separate them into individual opinions for a proper analysis. MonkeyLearn’s opinion unit extractor can be set up directly in your overall analysis, so you’ll be certain to analyze every idea and opinion separately:

Analyze data
If you’re working with quantitative data, you may be able to accomplish all the analytics you need in Excel – easy-to-use formulas, pivot tables, and graphs make simplistic data crunching easy. Or if you’re working with scale-rated CSAT or NPS surveys, survey tools like Typeform and SurveyMonkey offer built-in tools to calculate your scores.
However, if you’re ready to get even more fine-grained and in-depth with your data, it’s time to put machine learning to work for you. Instead of wasting countless hours manually tagging and analyzing your data with far too inconsistent human analysis, text-based data analysis tools, like MonkeyLearn, allow you to custom-train analysis models to the needs and criteria of your business.
Data analysis software helps you understand and interpret qualitative data to achieve your goals, and MonkeyLearn offers dozens of tools and techniques to get immediately actionable insights from all manner of text data.
Sentiment analysis can automatically read text for opinion polarity to understand the feelings and opinions behind thousands of comments, while keyword extraction can pull the most used and most important words and phrases to summarize short comments or whole texts, or help you understand emerging trends and topics.
Visualize data
Business intelligence (BI) and data visualization tools help simplify your data – to display an overall picture or view in minute detail – and create engaging, real-time stories to share with employees, stakeholders, and the general public.
Excel visualizations offer charts and graphs, for example:

But MonkeyLearn Studio is the only all-in-one text and data analysis solution, to take you from data collection and cleaning to analysis and visualization in just a few steps.
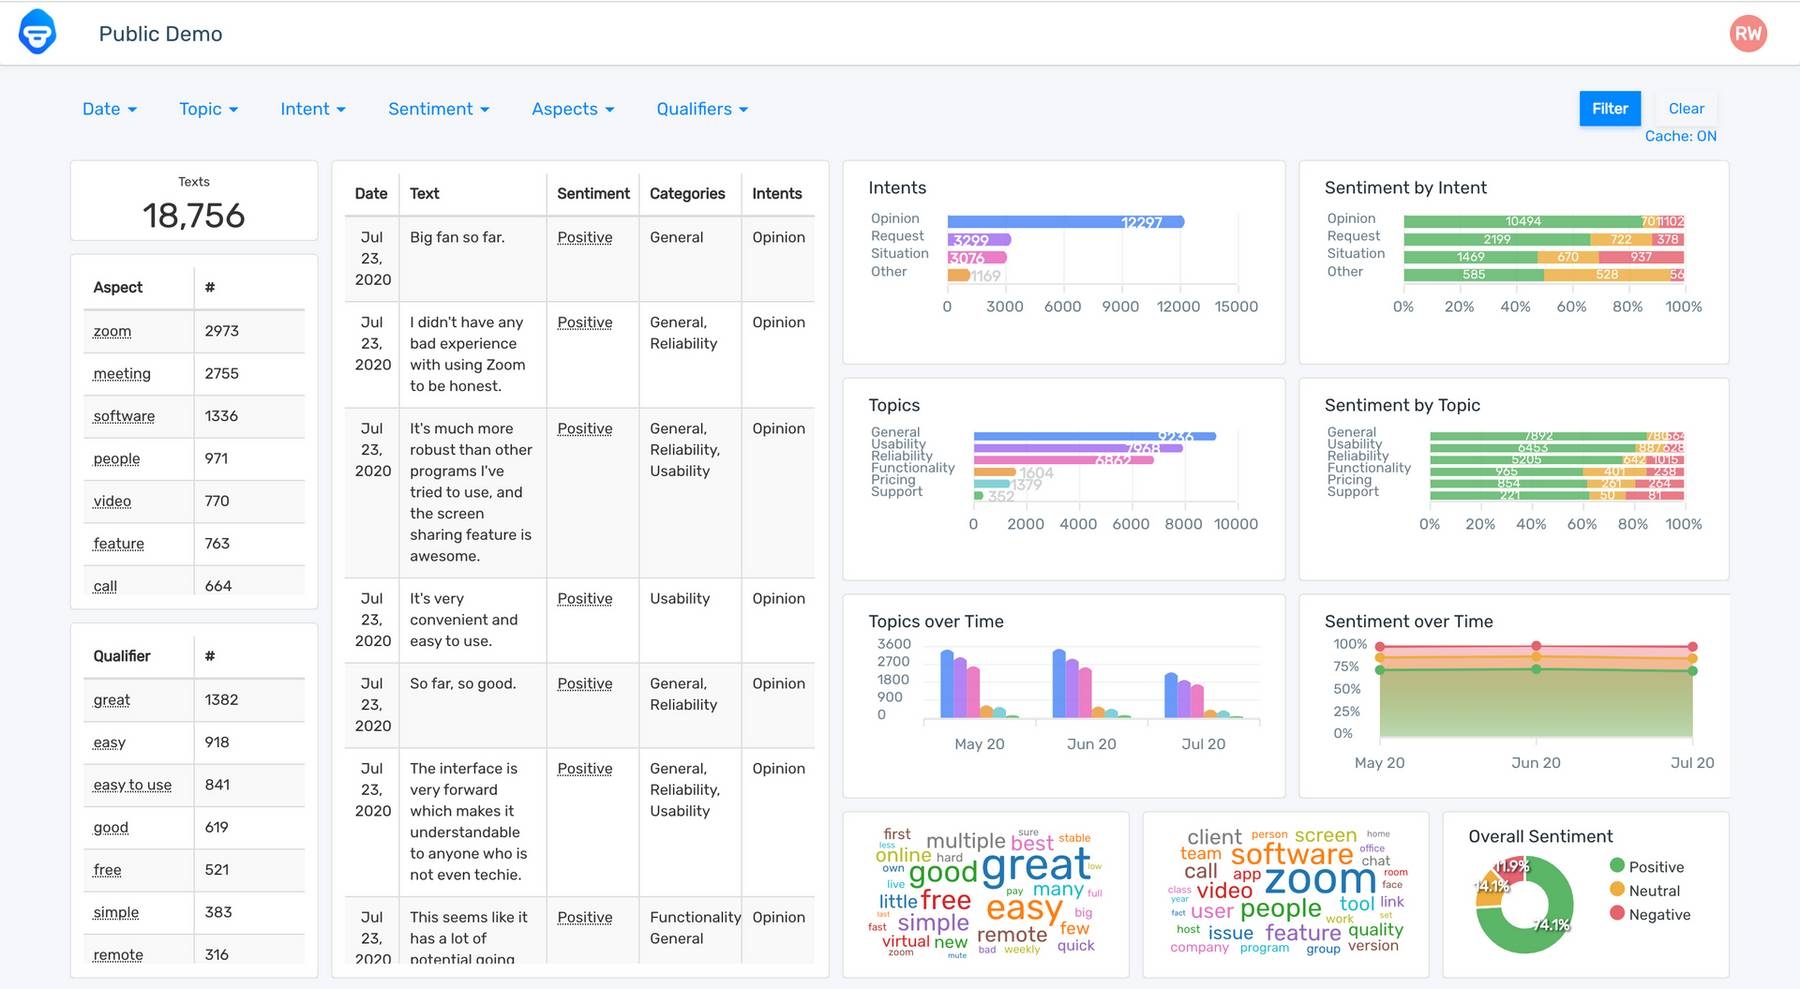
Take a look at this MonkeyLearn Studio public dashboard showing aspect-based sentiment analysis of Zoom customer reviews. We see the reviews categorized by aspect (Support, Reliability, Usability, etc.), then by sentiment, so we understand which aspects are performing positively and which negatively:

MonkeyLearn Studio allows you to set up an analysis then run it all from the dashboard – simple, seamless, and powerful.
Draw conclusions
Put your results to use, immediately. MonkeyLearn Studio analyses run in real time, 24/7, so you can follow customer sentiment, keywords, categories, and more, as they change over time, and immediately act on any problems that may arise.
Use your visualizations to get a point across – scroll through charts and graphs to show them in broad detail or identify individual cohorts and clusters, help pinpoint why customers may be churning, and more.
Get Started With Data Analysis
Data analysis offers varying techniques and processes for breaking down your data and analyzing it to help make data-driven decisions.
Tools like MonkeyLearn Studio can be massively helpful to improve processes, like customer service, or understand the customer experience and create new features that your product may be lacking.
Take a look at MonkeyLearn to learn about all the powerful text analysis tools we have to offer. Or sign up for a tutorial and we can walk you through setting up your own custom data analysis with MonkeyLearn Studio.

Rachel Wolff
February 18th, 2021


