Text Analytics Basics: A Beginner's Guide
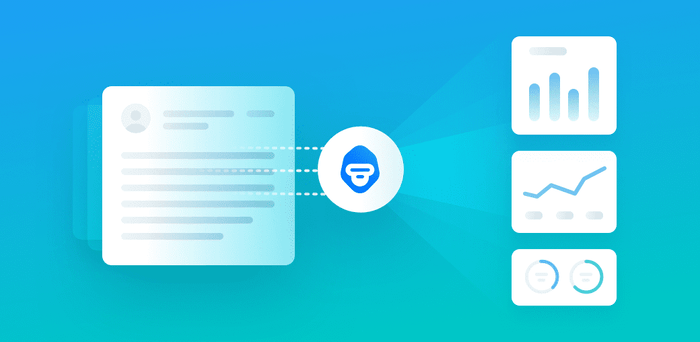
Text analytics is the automated process of translating large volumes of unstructured text into quantitative data to uncover insights, trends, and patterns. Combined with data visualization tools, this technique enables companies to understand the story behind the numbers and make better decisions.
When searching for a definition of text analytics, you may have come across related concepts, like text mining and text analysis. So, before going into the details, we’ll outline the main differences between these terms.
Text mining, text analysis, and text analytics are often used interchangeably, with the end goal of analyzing unstructured text to obtain insights. However, while text mining (or text analysis) provides insights of a qualitative nature, text analytics aggregates these results and turns them into something that can be quantified and visualized through charts and reports.
Text analysis and text analytics often work together to provide a complete understanding of all kinds of text, like emails, social media posts, surveys, customer support tickets, and more. For example, you can use text analysis tools to find out how people feel toward a brand on social media (sentiment analysis), or understand the main topics in product reviews (topic detection). Text analytics, on the other hand, leverages the results of text analysis to identify patterns, such as a spike in negative feedback, and provides you with actionable insights you can use to make improvements, like fixing a bug that’s frustrating your users.
How Can Text Analytics Help Companies?
Colossal amounts of unstructured data are generated every minute – internet users post 456,000 new tweets, 510,000 new comments on Facebook, and send 156 million emails – so managing and analyzing information to find what’s relevant becomes a major challenge.
Thanks to text analytics, businesses are able to automatically extract meaning from all sorts of unstructured data, from social media posts and emails to live chats and surveys, and turn it into quantitative insights. By identifying trends and patterns with text analytics, businesses can improve customer satisfaction (by learning what their customers like and dislike about their products), detect product issues, conduct market research, and monitor brand reputation, among other things.
Text analytics has many advantages – it’s scalable, meaning you can analyze large volumes of data in a very short time, and allows you to obtain results in real-time. So, apart from gaining insights that help you make confident decisions, you can also resolve issues in a timely manner.
Text Analytics Examples
One of the most interesting applications of text analytics in business is customer feedback analysis. This includes analyzing product and service reviews to see how your customers evaluate your company, processing the results of open-ended responses to customer surveys, or checking out what customers say about your brand on social media.
For example, let’s say you want to analyze NPS open-ended responses and find out which aspects of your business are being mentioned by your customers.
The first step would involve running a topic analysis, a text analysis technique that automatically tags NPS responses based on predefined categories, such as Feature Request and Customer Service. Here are a few examples:
“I wish you had an option to export the data” → Feature Request
“Customer support is really friendly and effective!” → Customer Service
Once you’ve tagged each NPS response, you can use text analytics to uncover patterns and insights across the whole dataset, and create charts or reports to display the results. Below, you can see a graph that shows how Retently used text analytics to map frequent topics in NPS responses:
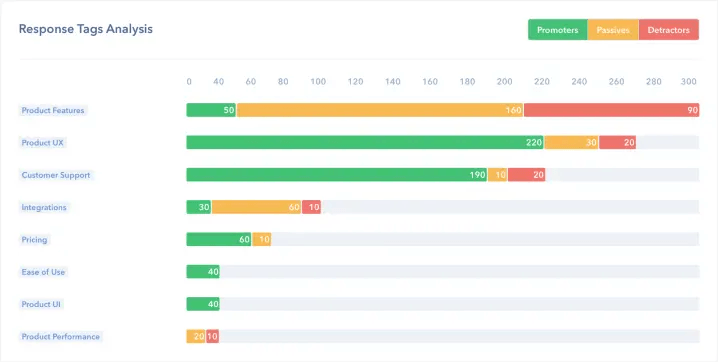
The chart shows that the majority of negative comments are related to Product Features, while most of the positive comments refer to aspects like Product UX and Customer Support. The negative comments suggest that implementing popular feature requests could help Retently increase their customer satisfaction.
Besides customer feedback analysis, another exciting application of text analytics in business is customer service. Using text analytics to analyze the content of support tickets, for example, can help you understand your customers’ needs, motivations, and expectations, and provide insights to rethink your customer experience strategy.
Aside from support tickets, you can also use text analytics to get key insights from other customer support channels such as email, chat, and social media. For example, we analyzed the customer support interactions on Twitter for telecommunication companies and found out that T-Mobile is the company with the most positive interactions:
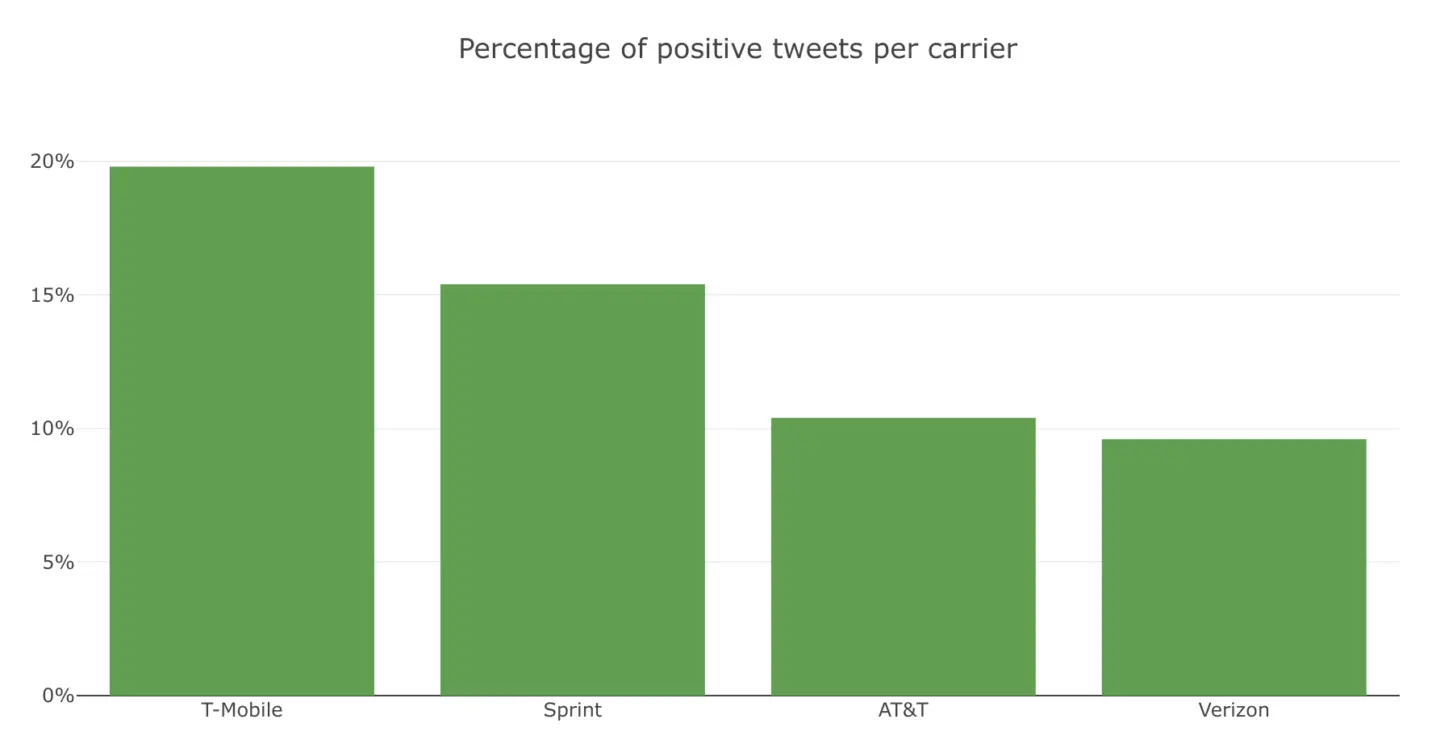
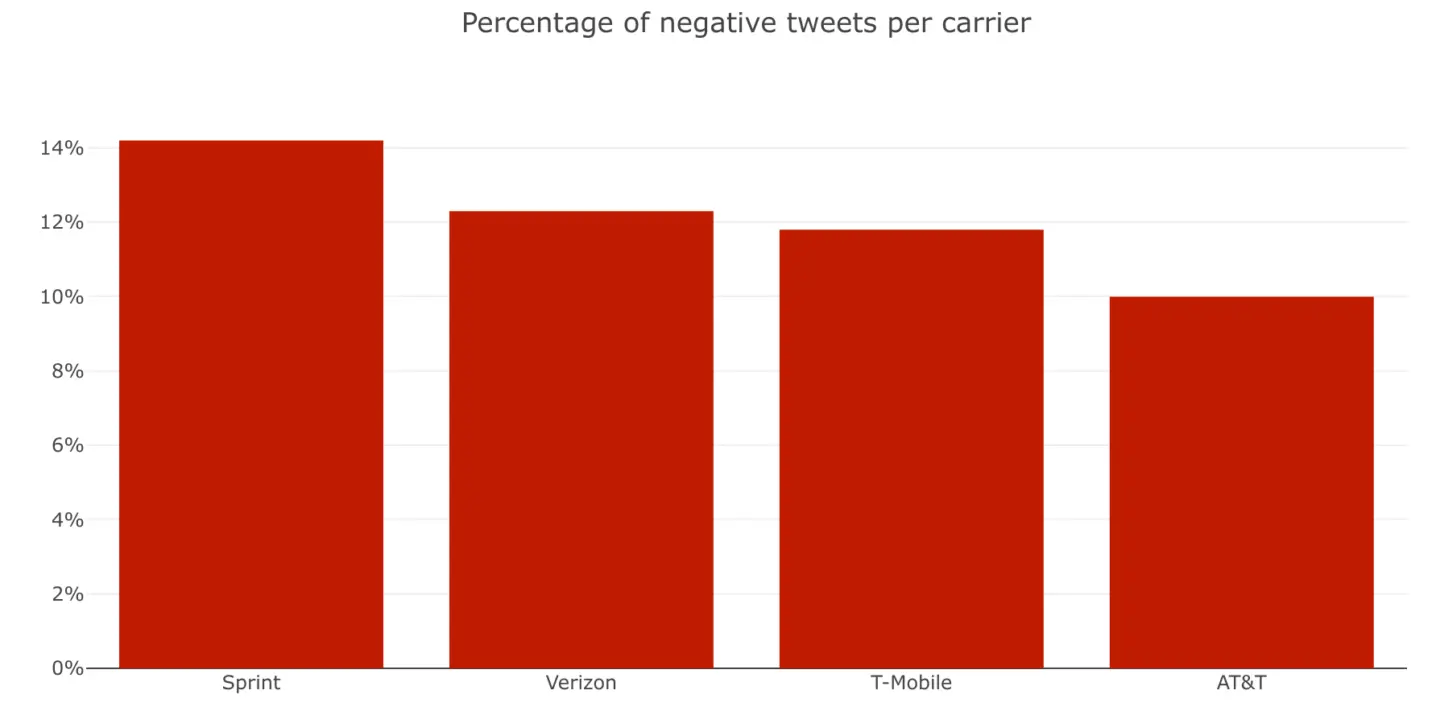
In contrast, Sprint is the company with the most negative mentions on Twitter:
Detecting a spike in complaints about your customer service in a timely manner, for instance, may indicate that you’ll need to provide further training to your agents, improve the routing process for support tickets, or make your help center easier to navigate.
How to Get Started with Text Analytics
Now that you are familiar with the variety of things you can do with text analytics, you probably want to know how to get started. Fortunately, there are many online tools available that allow you to take your first steps in a very intuitive way, even if you don’t have any programming skills. Let’s take a look at each step in detail:
1. Analyze Your Data
First, you’ll need to analyze the data you want to leverage with text analytics. MonkeyLearn offers different pre-trained machine learning models that you can use to perform text analysis right away. Check out this sentiment analysis model, for example, to get an idea of how they work.
You can also build your own customized machine learning models for text classification and text extraction, which is a great option if you need to recognize topics or keywords within a specific field.
You can create a custom model here by following these 5 steps:
- Choosing a type of model: Classifier or Extractor.
- Importing your data: you can use a CSV or Excel file or third-party integrations.
- Defining the tags you’ll use for the analysis.
- Training your model by manually tagging several examples. After a few examples, the model will start making its own predictions. If you are not completely satisfied with the results, you can always continue to train your model so that it improves its accuracy.
- Using your trained model to analyze new data: you can upload new data as a batch, use one of the integrations with third-party apps to analyze data automatically, or access the MonkeyLearn API.
For more information on how to create your own custom model, take a look at this How to Build a Custom Classifier tutorial.
2. Use BI Tools to Understand Your Data
Once you’ve completed your text analysis, you can create a data visualization of the results. Business intelligence tools like Google Data Studio, Looker, and Tableau, among others, can help you create attractive and interactive reports and charts to communicate the main insights of your data. Here’s an example of how you can visualize customer data with Looker:

Once your results look something like this, you’re ready to share them with the rest of your team.
Final Words
Text analytics allows companies to find meaningful information across a variety of data sources, from customer support tickets to social media interactions.
By aggregating the results of text analysis and using business intelligence tools to turn the numbers into easy-to-understand reports and graphics, text analytics can identify patterns, trends, and actionable insights that you can use to make data-driven decisions.
After analyzing customer feedback (like product reviews or NPS responses) or examining the content of customer support tickets with text analysis tools, you can leverage these results using text analytics to help you detect opportunities for improvement and adapt your product or service to your clients’ needs and expectations.
Getting started with text analytics can be quite simple, as there are many online tools that you can use to perform text analysis and visualize the results. Ready to take your first steps? Sign up for free to MonkeyLearn and start analyzing your data today!

Federico Pascual
November 20th, 2019


