Data Cleaning with Python: How To Guide

If you are going to invest in data cleaning do it right – with Python.
Now let’s take that loaded statement and walk it back a few paces. Data cleaning, aka data cleansing, is an integral part of data preparation.
What’s data preparation and what’s your point, you ask. Well, thank you, that’s what I was getting at. Proper data preparation is the essential, and if done improperly, costly backbone of effective data analytics.
Data analysis, and text analysis, have come into the crosshairs of every business interested in ongoing success in modern markets. Quite literally, the ability to analyze and quantify customer feedback, sales patterns, and other customer info has become the coin of the realm for businesses looking to make a name for themselves.
Learn from your current process, know thy customers, improve your process, outsell the competition is the name of the game.
This guide will explain the basics of what data cleaning is, then jump into the real stuff. Downstream, this guide will transform into a how-to for data cleaning with Python walking you through step by step.
1. What is Data Cleaning?
Data cleaning is the process of correcting or removing corrupt, incorrect, or unnecessary data from a data set before data analysis.
Expanding on this basic definition, data cleaning, often grouped with data cleansing, data scrubbing, and data preparation, serves to turn your messy, potentially problematic data into clean data. Importantly, that’s ‘clean data’ defined as data that the powerful data analysis engines you spent money on can actually use.
At MonkeyLearn, we like to explain why data cleaning is important with a simple approach:
- We explain the 1-100 Bad Data Principle, and
- We contextualize the principle with a couple choice quotes.
The 1-100 Bad Data Principle

Every dollar spent cleaning bad data statistically prevents around $100 in down-the-line costs.
For any business, ROI (return on investment) is crucial. If you invested in an advertising campaign, you’d hope to see an increase in sales.
What we hope to demonstrate with the 1-100 Bad Data Principle is not only that data cleaning provides staggering ROI. We also want to drive home that it’s value is so large that investing in data analysis, and the necessary data cleaning beforehand, is often a much sounder use of resources than the sales and advertising marketing techniques of the past.
As our CEO, Raúl Garreta, puts it,
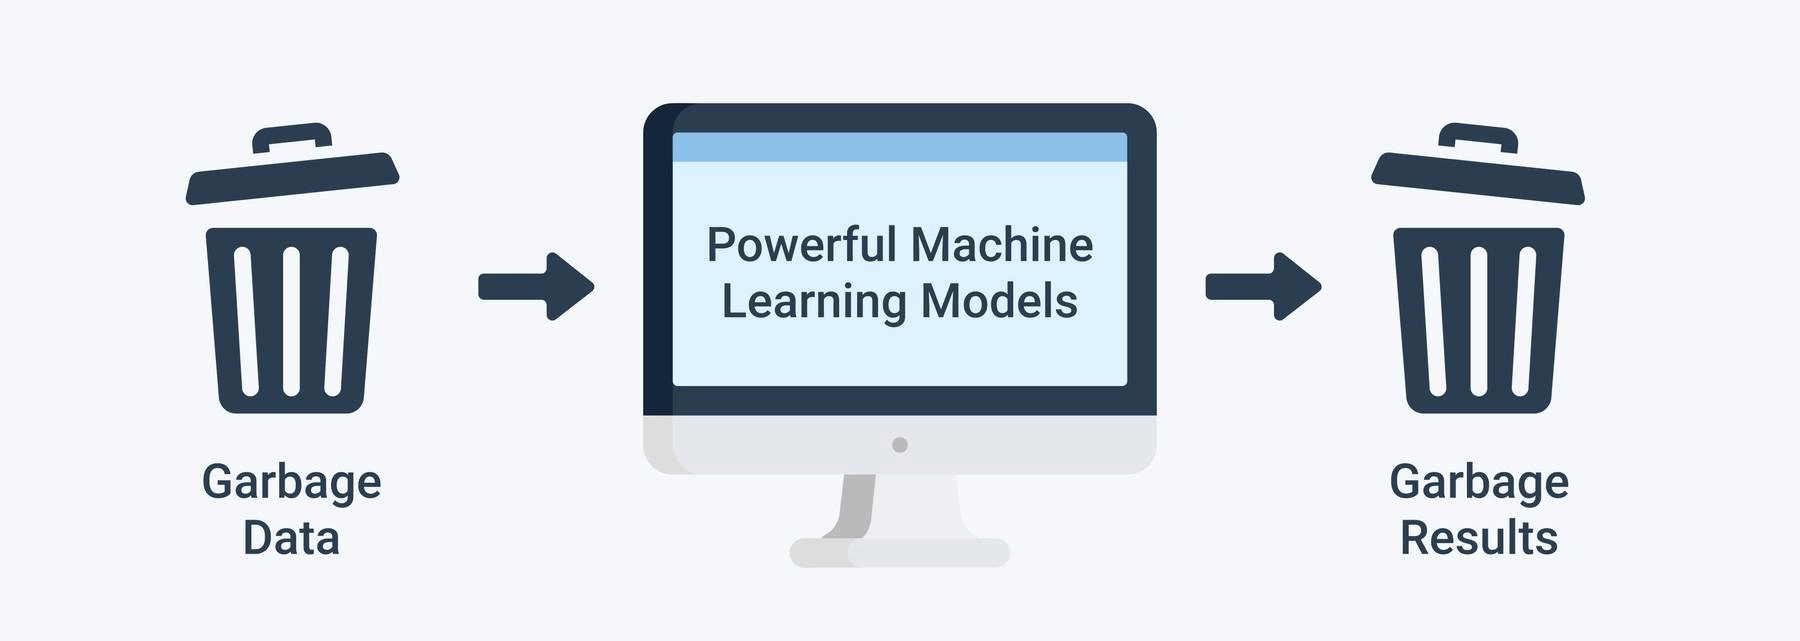
“If your downstream process receives garbage as input data, the quality of your results will also be bad”.
It’s key to note that Raúl’s insight applies no matter the strength of your data analysis program. That would be like putting diesel into a lamborghini.
With bad data it’s simple – garbage in, garbage out.
Now, the point of this guide is to inform you how to best perform data cleaning using Python. For the uninitiated, Python is one of the most common, if not the most common code language in the world.
Furthermore, and even more significantly, the vast majority of datasets can and are programmed using Python. Compounding Python's importance, Numpy and Pandas, both Python libraries (meaning pre-programmed toolsets) are the tools of choice amongst data scientists when it comes to data cleaning, prep, and other analysis.
What more does one need? Regardless, let’s get into the nitty gritty of cleaning our data with these libraries.
2. Data Cleaning With Python
Using Pandas and NumPy, we are now going to walk you through the following series of tasks, listed below. We’ll give a super-brief idea of the task, then explain the necessary code using INPUT (what you should enter) and OUTPUT (what you should see as a result). Where relevant, we’ll also have some helpful notes and tips for you to clarify tricky bits.
Here are the basic data cleaning tasks we’ll tackle:
- Importing Libraries
- Input Customer Feedback Dataset
- Locate Missing Data
- Check for Duplicates
- Detect Outliers
- Normalize Casing
1. Importing Libraries
Let’s get Pandas and NumPy up and running on your Python script.
INPUT:
import pandas as pd
import numpy as np
OUTPUT:
In this case, your script should now have the libraries loaded. You’ll see if this is true by inputting a dataset in our next step.
2. Input Customer Feedback Dataset
Next, we ask our libraries to read a feedback dataset. Let’s see what that looks like.
INPUT:
data = pd.read_csv('feedback.csv')
OUTPUT:
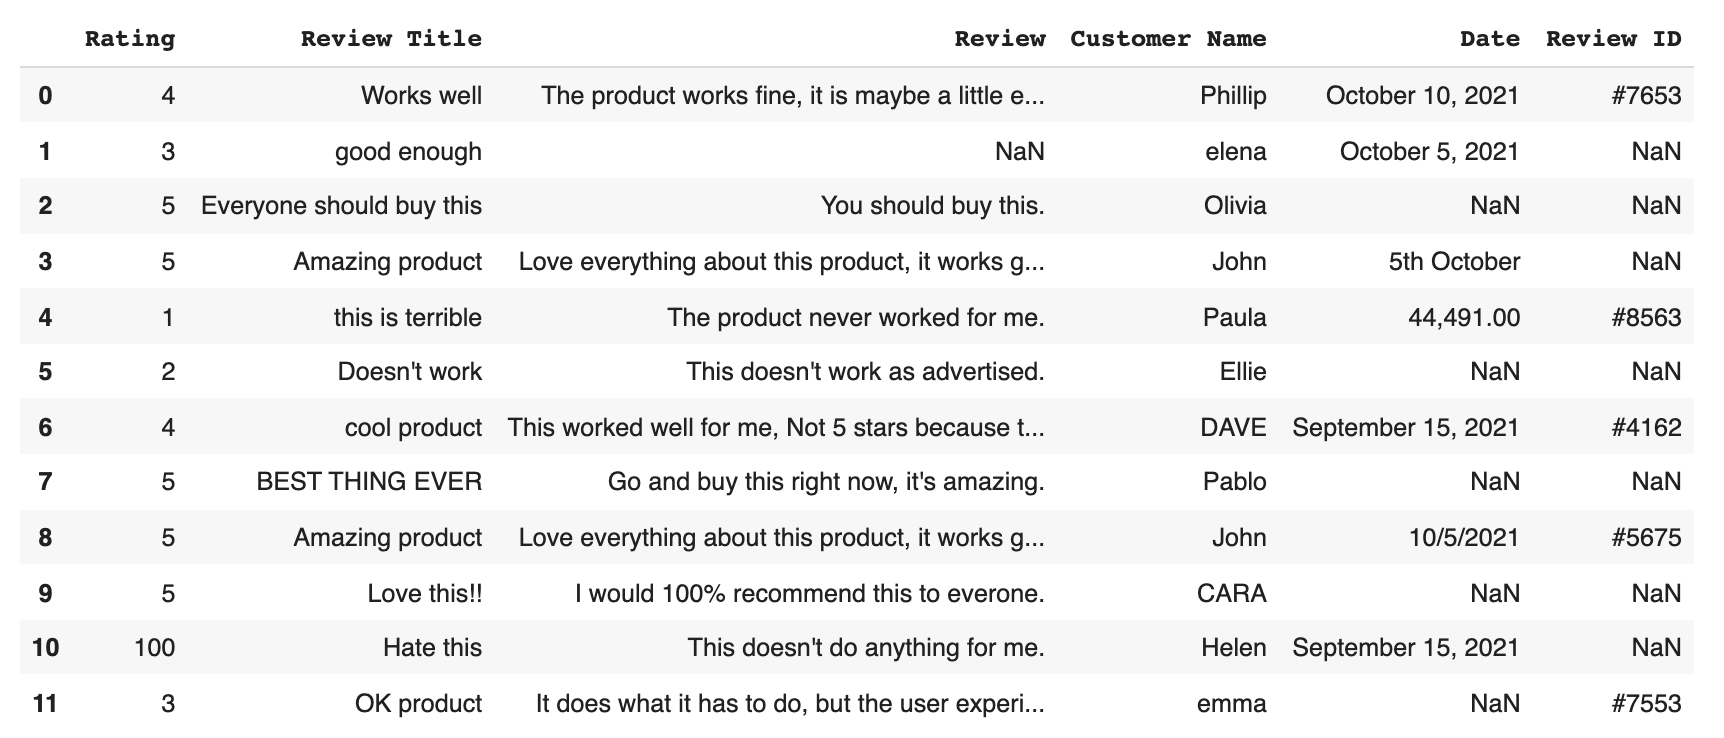
As you can see the “feedback.csv” should be the dataset you want to examine. And, in this case, when we read “pd.read_csv” as the prior function, we know we are using the Pandas library to read our dataset.
3. Locate Missing Data
Next, we are going to use a secret Python hack known as ‘isnull function’ to discover our data. Actually a common function, 'isnull' helps us find where in our dataset there are missing values. This is useful information as this is what we need to correct while data cleaning.
INPUT:
data.isnull()
OUTPUT:
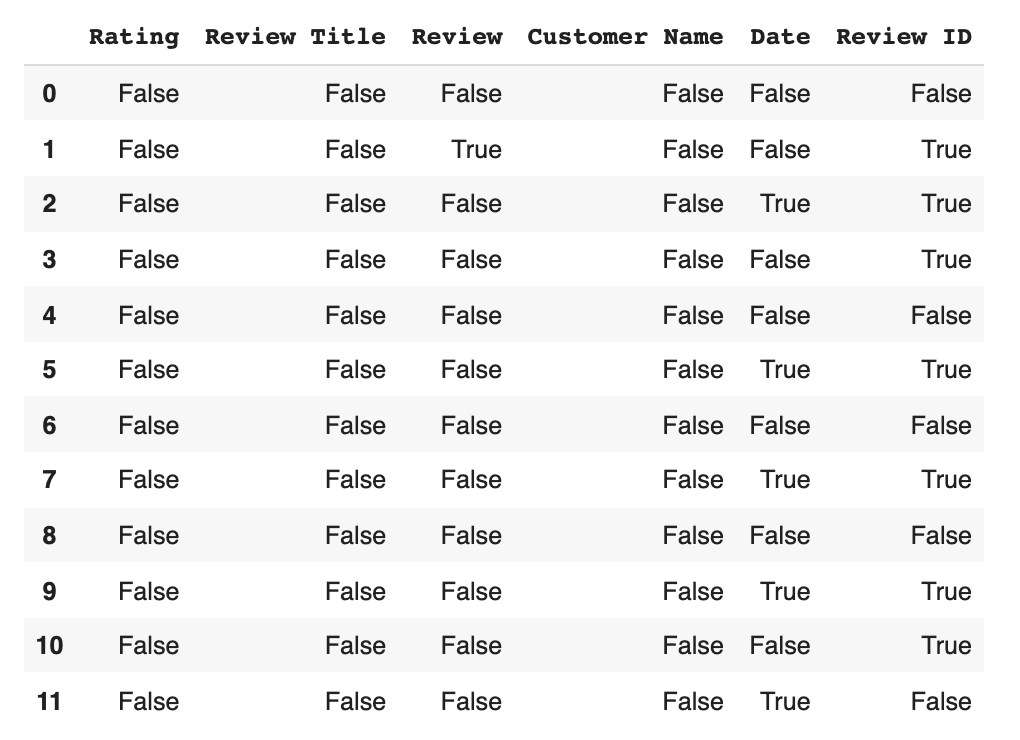
Our output result is a list of boolean values.
There are several insights the list can give us. First and foremost is where the missing data is – any ‘True’ reading under a column indicates missing data in that column’s category for that data file.
So, for example, datapoint 1 has missing data in its Review section and its Review ID section (both are marked true).
We can further expand the missing data of each feature by coding:
INPUT:
data.isnull().sum()
OUTPUT:
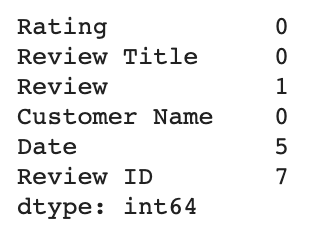
From here, we use code to actually clean the data. This boils down to two basic options. 1) Drop the data or, 2) Input missing data. If you opt to:
1. Drop the data
You’ll have to make another decision – whether to drop only the missing values and keep the data in the set, or to eliminate the feature (the entire column) wholesale because there are so many missing datapoints that it isn’t fit for analysis.
If you want to drop the missing values you’ll have to go in and mark them void according to Pandas or NumBy standards (see section below). But if you want to drop the entire column, here’s the code:
INPUT:
remove = ['Review ID','Date']
data.drop(remove, inplace =True, axis =1)
OUTPUT:
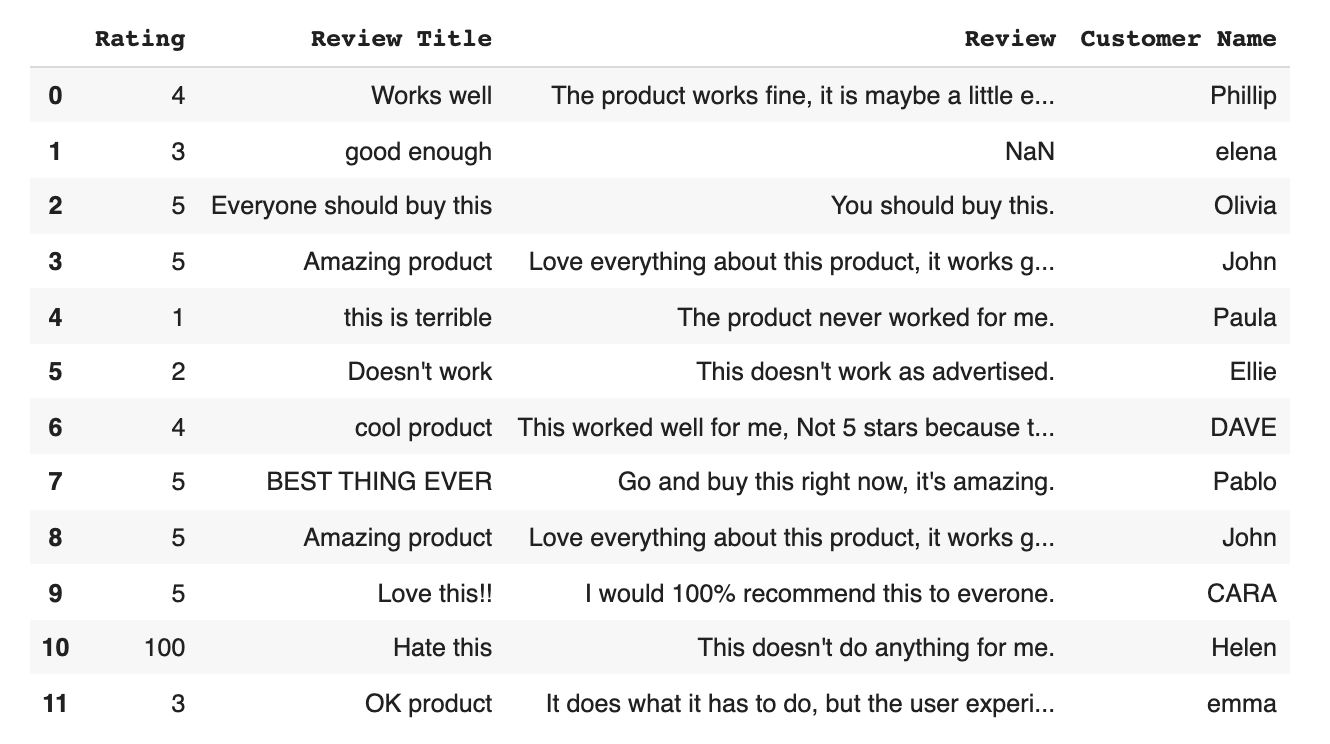
Now, let’s examine our other option.
2. Input missing data
Technically, the method described above of filling in individual values with Pandas or NumBy standards is also a form of inputting missing data – we call it adding ‘No Review’. When it comes to inputting missing data you can either add ‘No Review’ using the code below, or manually fill in the correct data.
INPUT:
data['Review'] = data['Review'].fillna('No review')
OUTPUT:
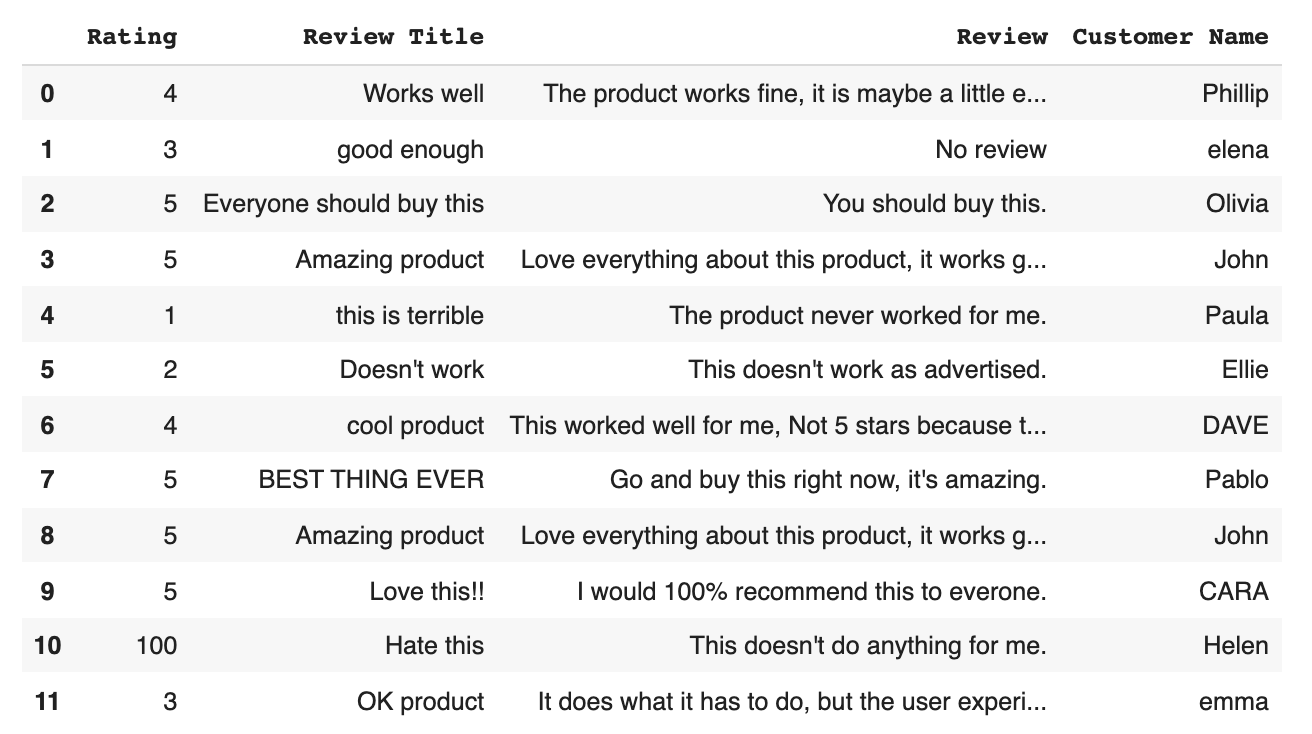
As you can see, now the data point 1 have now been marked as ‘No Review’ – success!
4. Check for Duplicates
Duplicates, like missing data, cause problems and clog up analytics software. Let’s locate and eliminate them.
To locate duplicates we start out with:
INPUT:
data.duplicated()
OUTPUT:
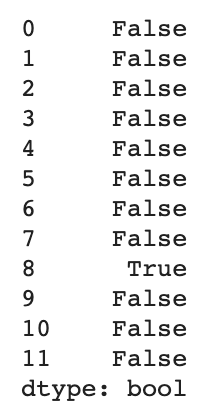
Aka a list of boolean values where a ‘True’ reading indicated duplicate values.
Let’s go and get ahead and get rid of that duplicate (datapoint 8).
INPUT:
data.drop_duplicates()
OUTPUT:
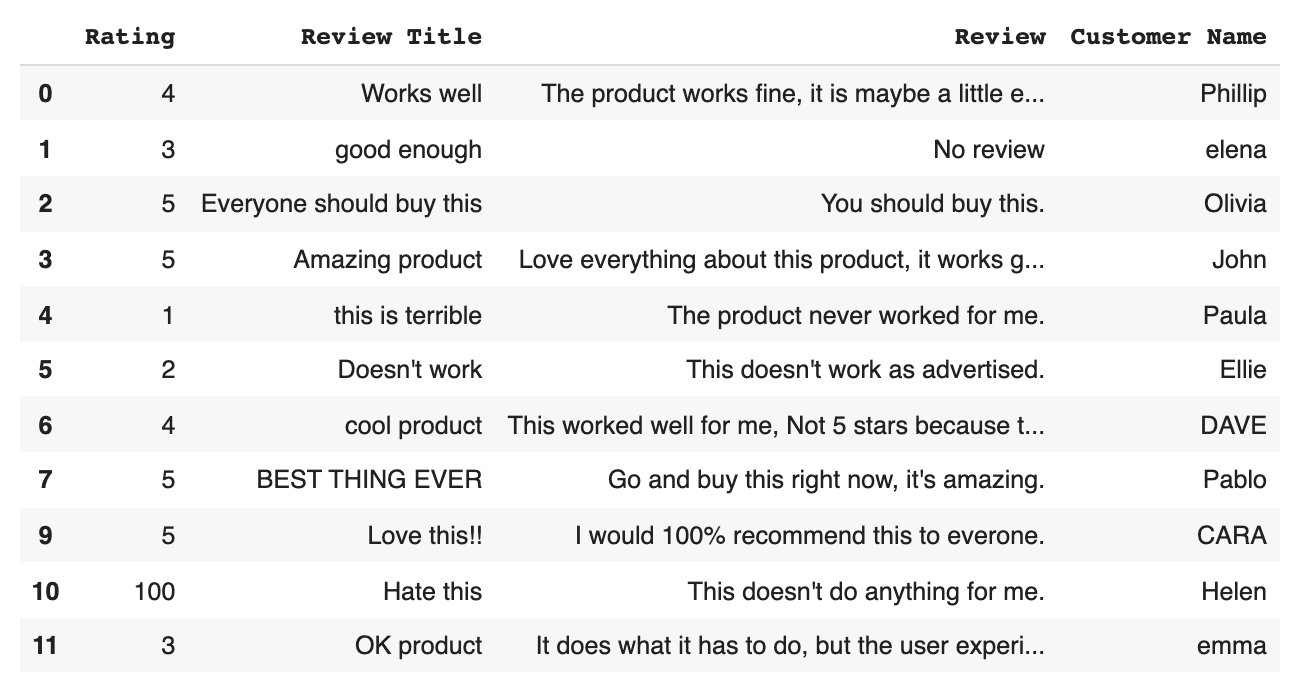
And there we have it, our dataset with our duplicate removed. Onwards.
5. Detect Outliers
Outliers are numerical values that lie significantly outside of the statistical norm. Cutting that down from unnecessary science garble – they are data points that are so out of range they are likely misreads.
They, like duplicates, need to be removed. Let’s sniff out an outlier by first, pulling up our dataset.
INPUT:
data['Rating'].describe()
OUTPUT:
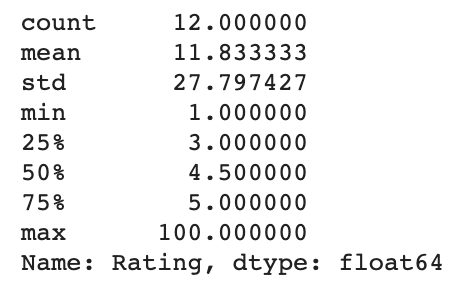
Take a look at that ‘max’ value - none of the other values are even close to 100, with the mean (the average) being 11. Now, your solution to outliers will depend on your knowledge of your dataset. In this case, the data scientists who input the knowledge know that they meant to put a value of 1 not 100. So, we can safely remove the outlier to fix our data.
INPUT:
data.loc[10,'Rating'] = 1
OUTPUT:
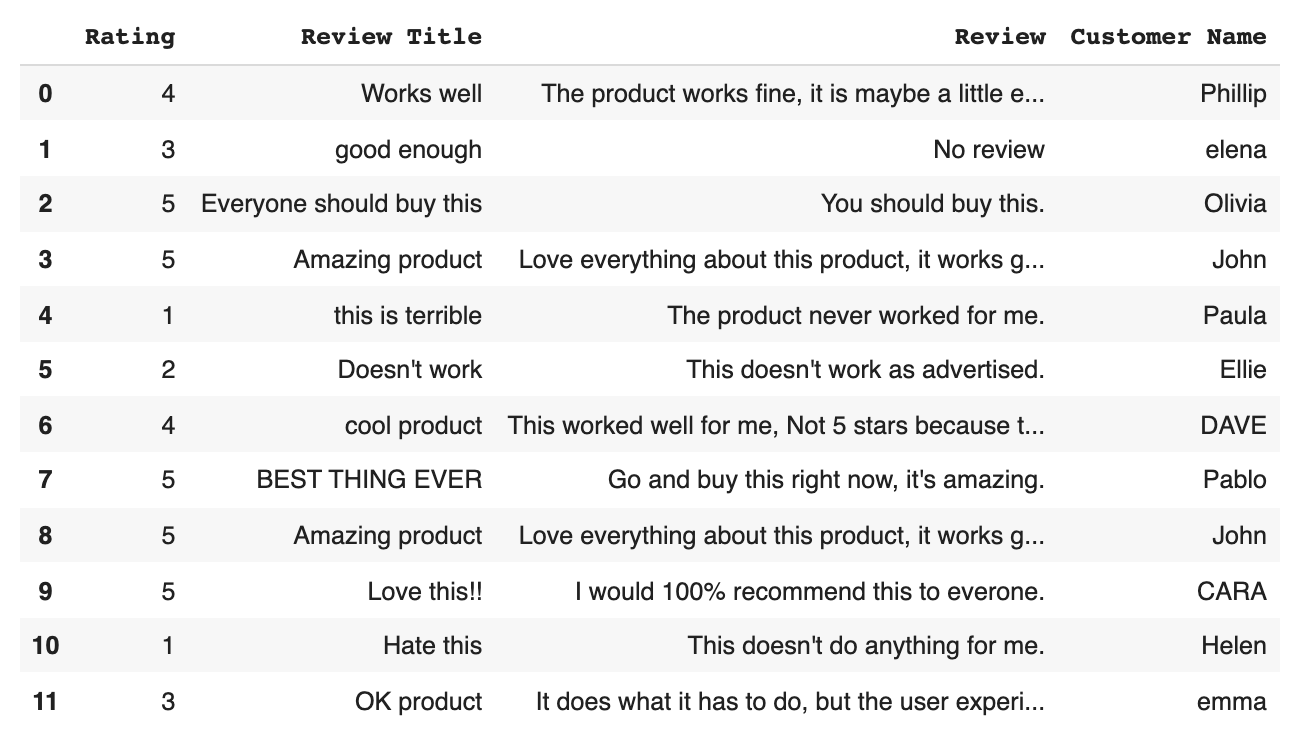
Now our dataset has ratings ranging from 1 to 5, which will save major skew from if there was a rogue 100 in there.
6. Normalize Casing
Last but not least we are going to dot our i’s and cross our t’s. Meaning we are going to standardize (lowercase) all review titles so as not to confuse our algorithms, and we are going to capitalize Customer Names, so that our algorithms know they are variables (you’ll see this in action below).
Here’s how to make every review title lowercase:
INPUT:
data['Review Title'] = data['Review Title'].str.lower()
OUTPUT:
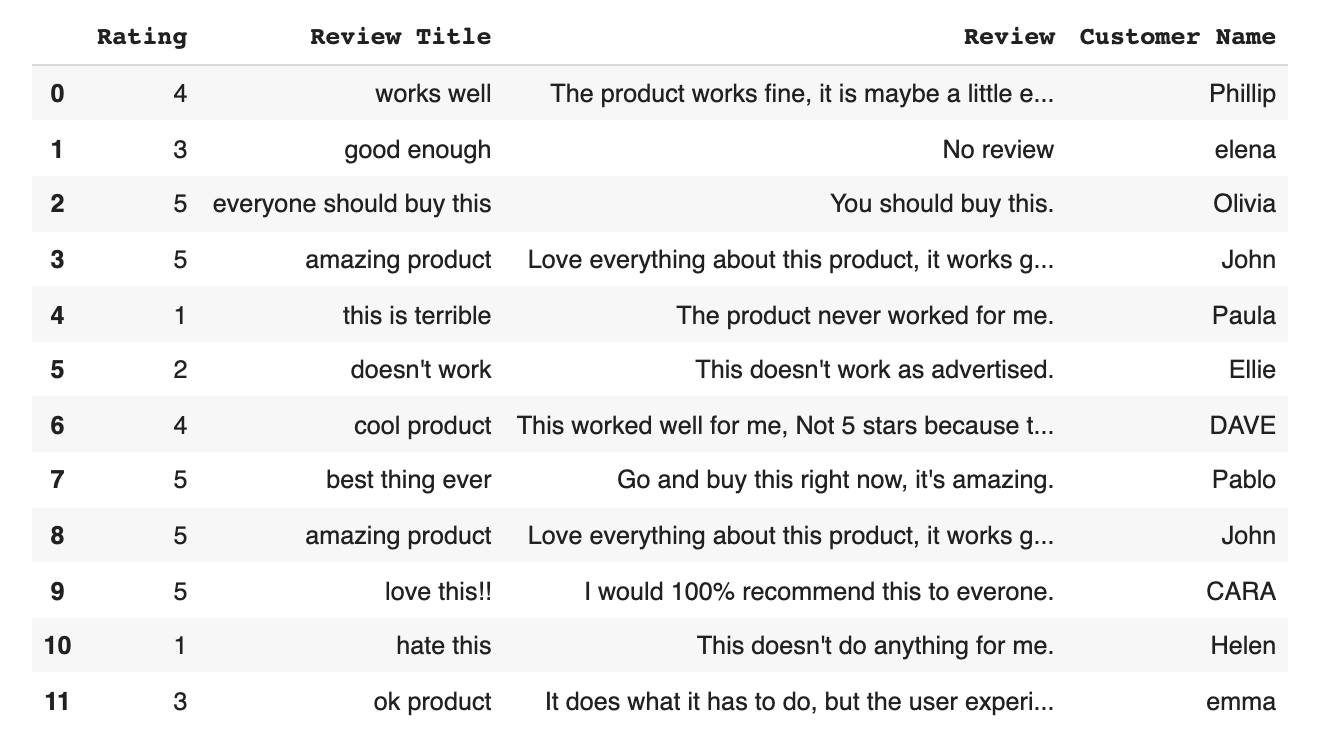
Looks great! On to making sure our high-powered programs don’t get tripped up and miscategorize a customer name because it isn’t capitalized. Here’s how to ensure Customer Name capitalization:
INPUT:
data['Customer Name'] = data['Customer Name'].str.title()
OUTPUT:
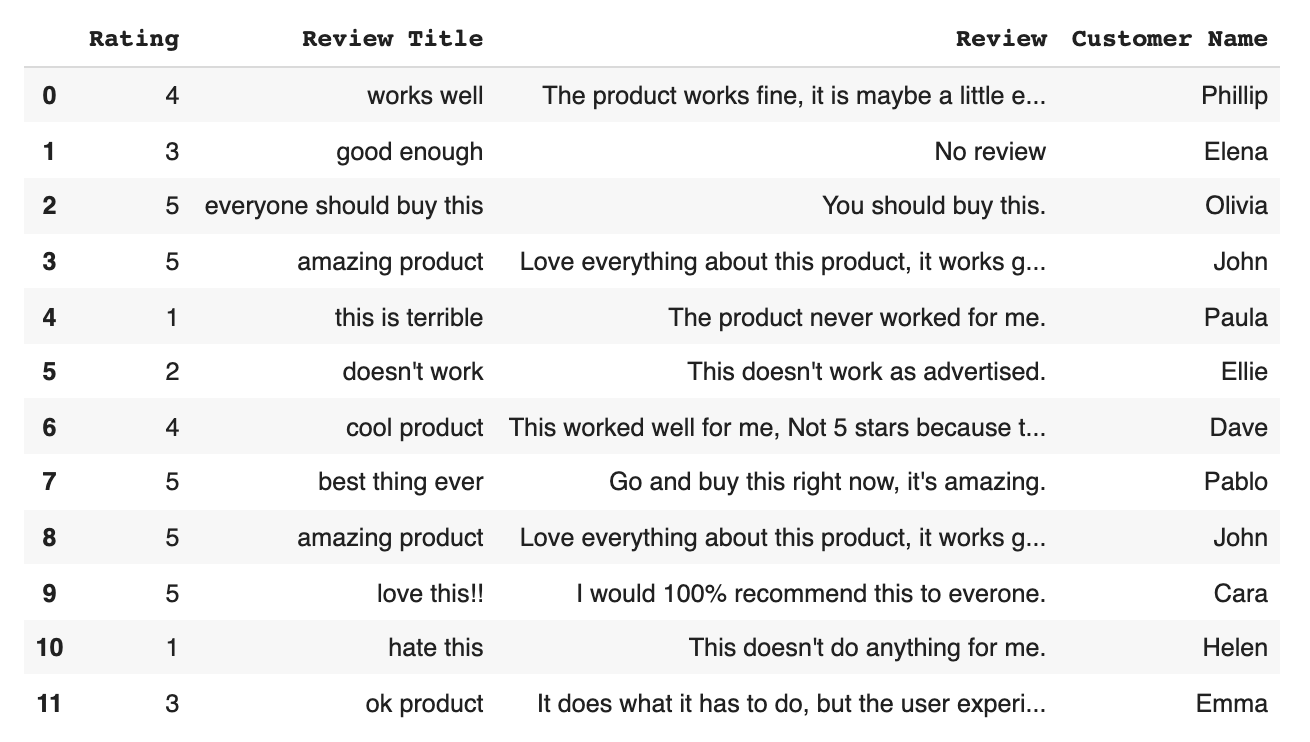
And there you have it – our data set with all the fixins’. Or, rather, with all the fix-outs: We’ve made good use of intuitive Python libraries to locate and eliminate bad data, and standardize the rest. We are now ready to make the most of it with our machine learning data analysis software.
Takeaways
Staying ahead of competition when it comes to data analysis isn’t easy - it seems like there are more powerful software and new functionalities being developed and launched every day.
But your data analysis is only as good as your data cleaning, which we covered here, and its compatibility with your analysis software. With clean data and a powerful (and easy-to-use) analysis software, you can stay on top of the game by relying on a process you control and understand.
MonkeyLearn’s text analysis and all-in-one data analysis studio are the perfect pairings for your clean data. Because our software focuses on API compatibility to both link up with your existing software and intake your new code, and also because of our open code library, our ease-of-use and process control are second to none.
See how MonkeyLearn works for yourself.

Rachel Wolff
November 4th, 2021


