What Is Data Wrangling & Why Is It Necessary?

When it comes to data analysis, your results are only as good as your data. And, even if you have millions of data points and the power of AI and machine learning on your side, you may not be using the data to its full potential (you may even be using it to the detriment of your organization).
Bad data means bad decision-making.
So you need to clean and format your data – get it under control, so it’s prepared for downstream processes.
That’s where data wrangling comes in.
- What Is Data Wrangling?
- Data Wrangling Examples
- Why Is Data Wrangling Important?
- The Data Wrangling Process
- Data Wrangling Approaches & Tools
What Is Data Wrangling?
Data wrangling or data munging is the process of gathering, sorting, and transforming data from an original “raw” format, in order to prepare it for analysis and other downstream processes.
Data wrangling is different from data cleaning because it goes beyond merely removing inaccurate and irrelevant data and more thoroughly transforms it, reformats it, and prepares it for eventual downstream needs.
“Wrangling” because it’s about managing and manipulating data – lassoing it, as it were – so it’s more completely gathered and organized for whatever you need to use it for. It takes it from a raw format and turns it into the format(s) you need for whatever analysis you need to do.
In data science and data analysis, the amount of work that goes into data wrangling is embodied by the 80/20 rule – data scientists typically spend 80% of their time ‘wrangling’ or preparing data and 20% of their time actually analyzing the data.
Even with massive advancements in AI and machine learning, data wrangling is still largely manual, or humans need to at least guide computer programs through the process. AI is not yet advanced enough that it can merely be “set loose” on raw data to properly transform it for downstream needs. There are, however, a number of open source and SaaS tools that have made the process much easier.
Data munging requires advanced knowledge of the raw data, what kinds of analyses it will be run through, and what information needs to be removed. A number of strict rules and guidelines need to be put in place to ensure that the data is properly cleaned and prepped, or your analysis will be skewed or completely useless.
Data Wrangling Examples
Data wrangling is generally applied to individual “data types” within a data set: rows, columns, values, fields, etc. Data munging and wrangling examples include:
- Removing data that is irrelevant to the analysis. In text analysis this could be stop words (the, and, a, etc.), URLs, symbols and emojis, etc.
- Removing gaps in data, like empty cells in a spreadsheet or blank spaces between words in a document.
- Combining data from multiple sources and multiple sets into a single data set.
- Data parsing: for example, turning HTML into a more standardized/easily analyzable format.
- Data augmentation to create more robust machine learning models: for example, synonym replacement and random word deletion.
- Filtering data according to locations, demographics, periods of time, etc.
These are processes that will wrangle the outputs to be prepared for downstream needs.
These can be automated processes, but the data scientist or individual performing the wrangling must know which kinds of actions are relevant to their needs and direct the programs to perform the distinct actions they need.
Why Is Data Wrangling Important?
If you’re not running your analysis with good, clean data, your results will be skewed – often to the point that they’ll actually be more harmful than helpful. Basically, the better the data your input, the better your results will be.
Furthermore, as you increase the amount of raw data you’re using, you’ll also increase the amount of inherently “bad” or unnecessary data within these data sets. However, when you set up a proper data wrangling process, you’ll be able to clean this data more rapidly as you progress through it, because you’ll have the systems in place to handle it all.
This means you can work with more and more complex data as you go along.
The more you use bd data and the longer you use it, the more it will cost your organization, both financially and in wasted time. This is relevant to both quantitative (structured) and qualitative (unstructured) data.
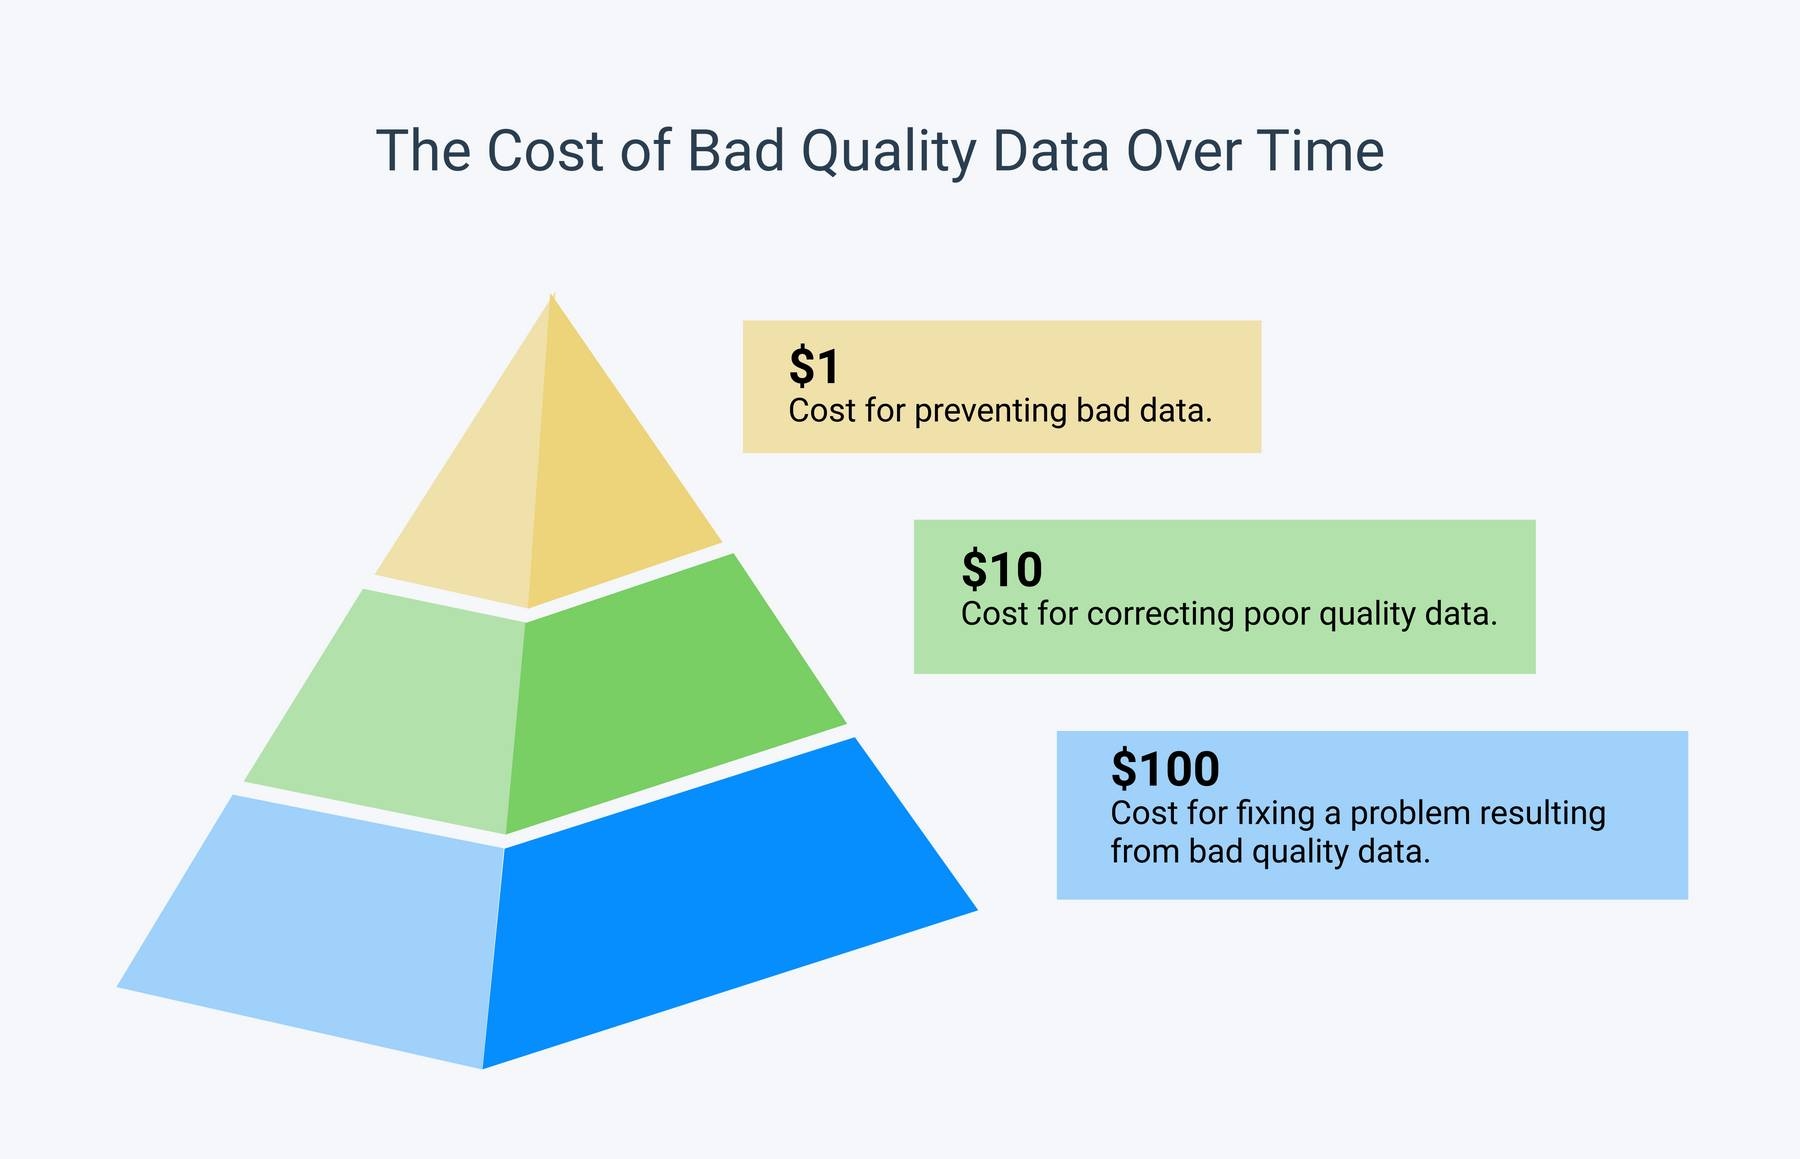
It comes down to the 1-10-100 principal.
It’s more cost-effective and time-effective to invest $1 in prevention, than correct the problematic data for $10, or spend $100 to fix a complete failure.
With AI and machine learning, for example, if you build a model with bad data, the resulting machine learning model will perform very poorly, even negatively.
Data scientists will often tell you that better data is even more important than having the most powerful algorithms, and that data wrangling is actually the most important step in data analysis.
If you don’t start with good data, your downstream processes are basically useless.
The Data Wrangling Process
There are 6 steps to data wrangling that are generally accepted as universal by the data science community:
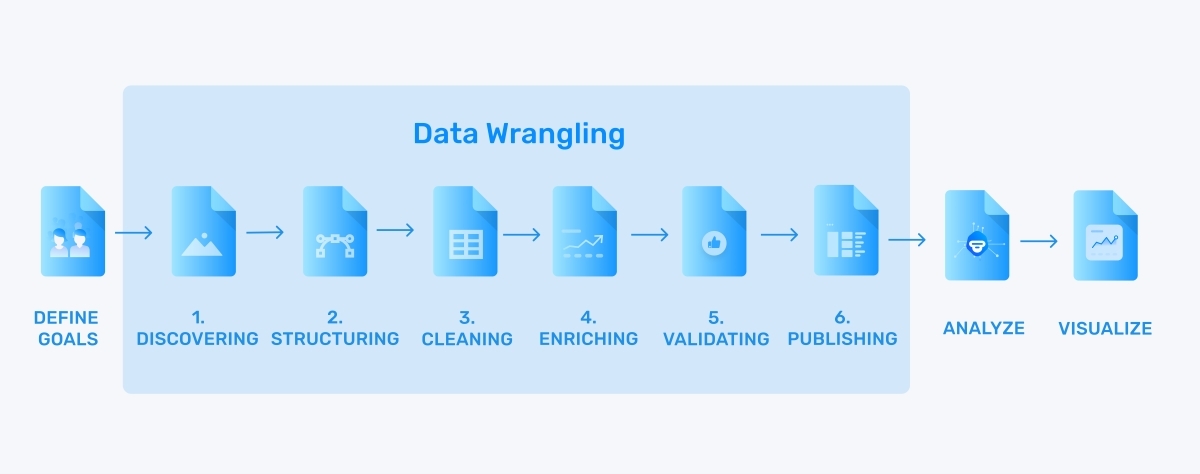
1. Discovering
Discovering or discovery is the first step to data wrangling – it’s about getting an overview of your data. What’s your data all about? Familiarize yourself with your data and think about how you might use it or what insights you might gain from it.
When you look over it or read through it, you’ll begin to see trends and patterns that will be helpful to conceptualize what kind of analysis you may want to do. You’ll also likely see immediate issues or problematic data points that you’ll need to correct or remove.
2. Structuring
Next you’ll need to organize or structure your data. Some data, that’s entirely entered properly into spreadsheets (like a hotel database, for example), comes pre-structured. But other data, like open-ended survey responses or customer support data is unstructured and isn’t usable in its raw state.
Data structuring is the process of formatting your data, so that it’s uniform and will be ready for analysis. How you structure your data will depend on what raw form your data came in and what kinds of analyses you want to do – the downstream processes.
3. Cleaning
Data cleaning is the process of removing irrelevant data, errors, and inconsistencies that could skew your results. The data cleaning process includes removing empty cells or rows, removing blank spaces, correcting misspelled words, or reformatting things like dates, addresses, and phone numbers, so they’re all consistent. Data cleaning tools will remove errors that could negatively influence your downstream analysis.
4. Enriching
Once you have come to understand the data you’re working with and have properly converted and cleaned it for analysis, it’s time to decide if you have all of the data needed for the task at hand. Occasionally, after the cleaning process, you may realize that you have much less usable data than you initially thought.
Data enrichment combines an organization’s internal data from customer support, CRM systems, sales, etc., with data from third parties, external sources, social media feedback, and relevant data from all over the web.
The general rule with machine learning is that more data is better. But it will all depend on the project at hand. If you decide to add more data, simply run it through the processes above and add it to your previous data.
Enriched data will help create personalized relationships with customers and provide a more holistic understanding of your customers’ needs. When a company fails to regularly enrich their data, they won’t have as strong of an understanding of their customers and will provide them with inapplicable information, marketing materials, and product offerings.
5. Validating
Data validation is the process of authenticating your data and confirming that it is standardized, consistent, and high quality. Verify that it is clean and regularly structured. This process often uses automated programs to check the accuracy and validity of cells or fields by cross-checking data, although it may also be done manually.
6. Publishing
Now that your data is validated, it’s time to publish it. The final step to prepare data for downstream processes. This could mean sharing across your business or organization for different analytical needs, or uploading it to machine learning programs to train new models or run through pre-trained models. There are different formats to share the data, depending on your needs and goals, from a variety of electronic files to CSV documents to written reports.
These six steps are a continual process that you’ll need to run on any new data to ensure that it’s clean and ready for analysis.
Although tedious, data wrangling is ultimately rewarding because it will produce exponentially better results.
Here’s a basic example of what data wrangling looks like in practice. All the data points have been standardized, making the data easier to analyze:
Starting Data
| Name | Phone | Birth Date |
|---|---|---|
| Tanner, Steve | 844.556.1234 | August 12, 1977 |
| Betty Orlando | 211-433-8976 | 11/14/65 |
| Johnson, Will | (554)3133344 | 12 September 1974 |
| Tammy Watson | 334-5567 | 6-04-48 |
Result
| Name | Phone | Birth Date |
|---|---|---|
| Steve Tanner | 844-556-1234 | 1977-08-12 |
| Betty Orlando | 211-433-8976 | 1965-11-14 |
| Will Johnson | 554-313-3344 | 1974-09-12 |
| Tammy Watson | 544-334-5567 | 1948-06-04 |
Let’s take a look as some data wrangling techniques and tools to ensure that you’re set up for the best results.
Data Wrangling Approaches & Tools
One of the best attributes a good data wrangler can have is knowing their data from front to back. It’s important that you understand what is contained in your data sets, what your downstream data analysis tools will be, and your end goals.
Traditionally most data wrangling has been done manually with spreadsheets, like Excel and Google Sheets. This is typically a good solution when you have small data sets that don’t require a whole lot of cleaning and enriching.
When you’re tackling larger amounts of data, you’re probably better off with more advanced technology. If you know how to code, there are a number of code toolboxes that can be extremely helpful for data wrangling tasks.
Wrangling tools like KNIME are great for scaling up, but you’ll need to be generally proficient in languages, like Python, SQL, R, PHP, or Scala.
There are some great no-code SaaS tools for data wrangling. Even coders are turning to no-code or low-code tools these days, for their ease-of-use and friendly interfaces. And these tools still allow those who want to perform some code or more in-depth data wrangling the chance to write their own code within them.
No code data wrangling tools
Trifacta Wrangler
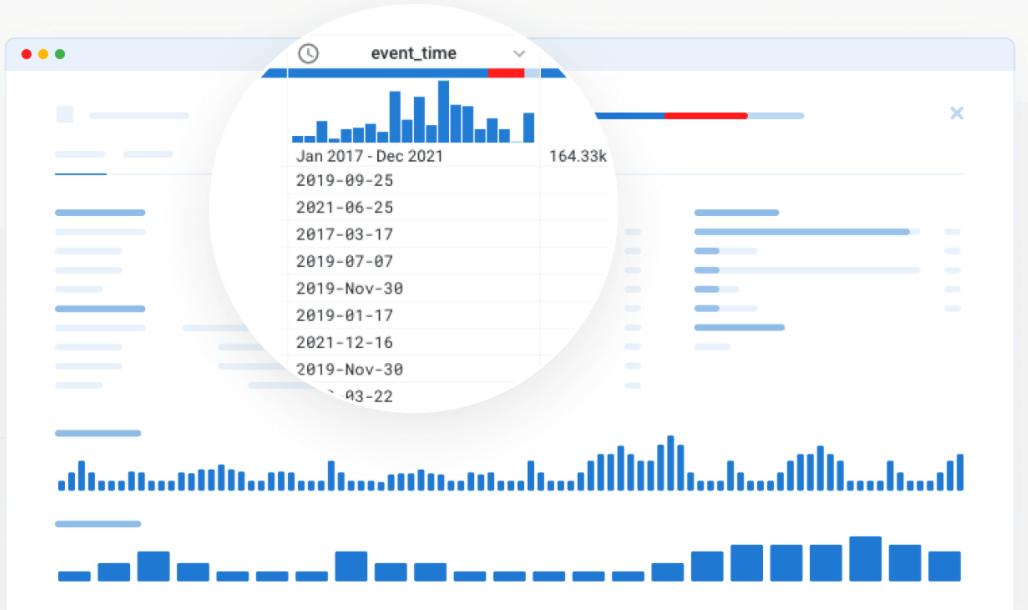
Trifacta Wrangler is a fully integrated data wrangling solution that came out of the original Data Wrangler from research at Stanford.
Trifacta’s easy-to-use dashboard allows no-code users and coders, alike, to collaborate on projects across an organization. And their cloud scalability allows Trifacta to be put to work on projects of any size and automatically export wrangled data into Excel, R, Tableau, and more.
Open Refine
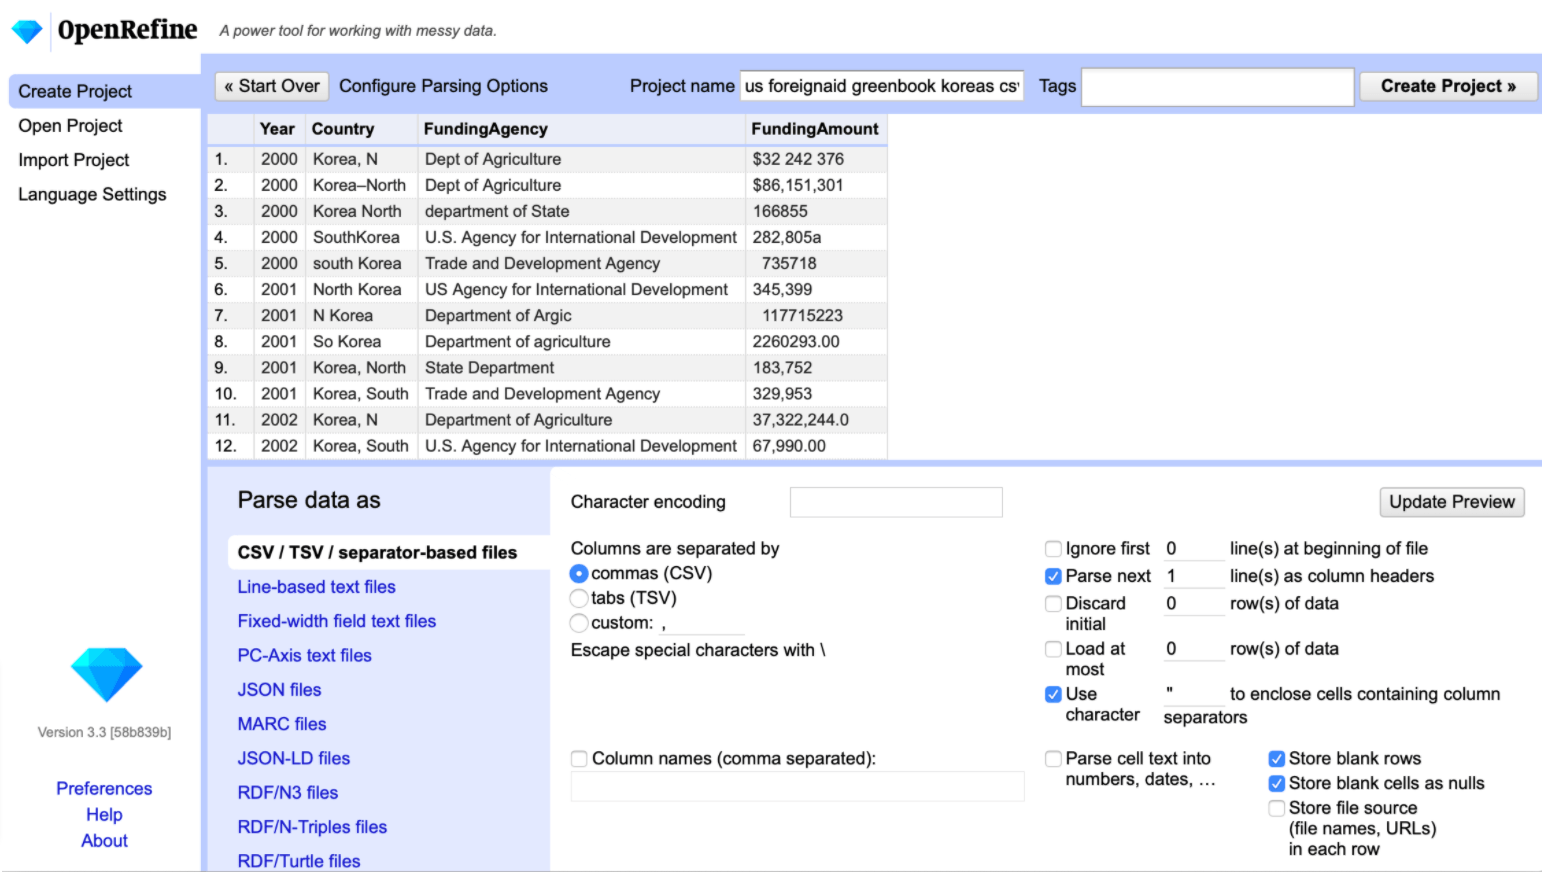
Previously a strictly SaaS product called Google Refine, Open Refine has extended a hand to the coding community to build advancements as they see fit. It’s powerful and simply GUI allows users to quickly examine, explore, and clean data without any code. But the Python capabilities mean you can handle even more complex data filtering and cleaning with your own code.
The Wrap Up
Data wrangling is both the new frontier and the new industry standard when it comes to gathering, cleaning, and preprocessing data for analysis. When used properly it can help ensure that you use the best, cleanest data possible and set yourself up for successful downstream processes.
Wrangling or data munging can be a tedious process, but once you see the powerful results, you’ll be happy you’ve added it to your arsenal of data analytics tools.
MonkeyLearn is a SaaS text analysis platform with powerful tools to help get the most out of your text data. Take a look at MonkeyLearn to see how we can help you get the most out of your data.
Or sign up for a demo to learn more about text analysis and get some tips on data wrangling.

Rachel Wolff
May 14th, 2021


