

Survey Data Cleaning: Practical Steps to Accurate Survey Results


Your survey responses are in, but before you start analyzing them you'll need to clean your survey data.
Unclean or dirty survey data could skew your results, leading to poor insights and, as a result, bad decision making.
In this guide we'll explain exactly what data cleaning is and what you need look out for when you clean your data.
At the end, we'll reveal the most effective way to analyze your clean survey data.
- What Is Data Cleaning?
- Benefits of Cleaning Survey Data
- How to Clean Survey Data
- Your Survey Data Is Clean & Ready to Analyze
What Is Data Cleaning?
Data cleaning is the process of filtering your data and removing any bad or unnecessary information.
Bad or dirty data is anything that is inaccurate or could lead you to draw misleading conclusions from your survey results.
"If your downstream process receives garbage as input data, the quality of your results will also be bad". -- Raúl Garreta, CEO and Co-Founder of MonkeyLearn.
Bad or dirty data can be common in survey results due to a number of reasons.
Here are just a few examples of why bad data is common in survey responses:
- Respondents might choose the first response to every survey question without reading the questions properly, just to complete the survey faster or because they want to receive the reward as soon as possible. These respondents are known as speeders.
- Sometimes users type in random symbols or letters either on purpose or by accident. Those that intentionally leave nonsensical feedback are known as Dodgers, and add anything to move past the question.
- Survey fatigue can play a huge factor in the quality of your survey responses. It's where the respondent gets tired of answering survey questions, either because the survey is too long or the questions are hard to understand or answer.
Whatever the reason for dirty data, you'll need to clean your surveys before you even consider analysis so that you are left with survey data that is accurate, consistent, and well organized.
If you don't, you could end up with inaccurate results that lead you to make ill-informed business decisions.
Benefits of Cleaning Survey Data
Before we jump into some practical steps on how to clean your data, here are a few reasons why you should never skip cleaning your survey data:
You'll make better business decisions. Surveys are your ticket to understanding what your customers, employees, or target audience are thinking and what they need from you as an organization. The cleaner you survey data, the more solid insights you'll have about what they need, allowing you to make business decisions that will make sense to them. Insights from clean data also make it easier to get buy-in from stakeholders.
Clean survey data keeps costs down. Running survey analysis with dirty data means you're likely to get inaccurate results back. The re-do process to get things right can be costly. Going back to square one also wastes the time of your data specialists whose time could be better spent on other tasks.
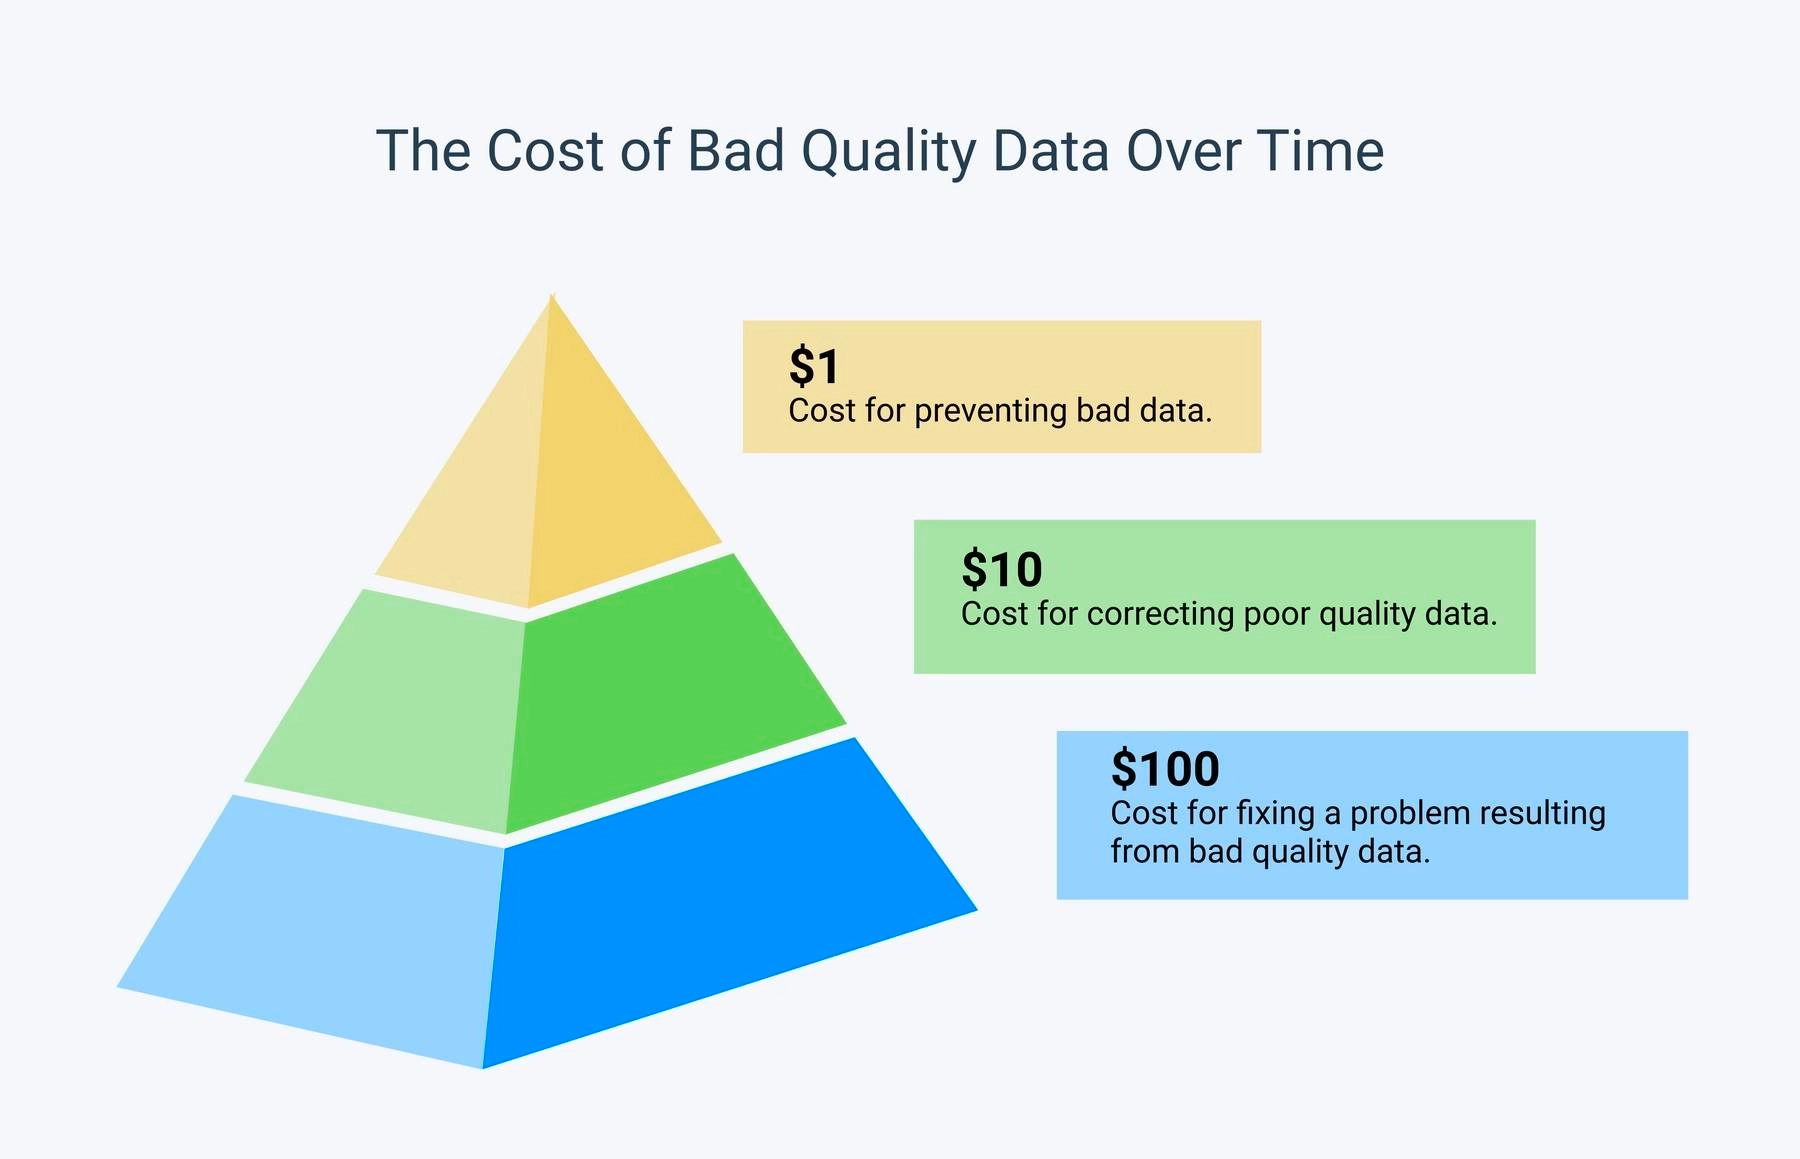
Take a look at the 1-10-100 rule, in the diagram below, which shows the additional costs you'll incur to identify and correct data errors the further along the data analysis process you go.
![Cost of bad data: $1 for preventing it. $10 for correcting it. $100 for fixing a problem caused by bad data.]()
Let's explain this in simple terms.
It makes more sense to invest $1 in preventing bad data getting through the door, than to spend $10 on correcting poor quality data or $100 on fixing a problem that arises from making decisions based on bad quality data.
Customers will be more satisfied. If you are surveying your customers or employees you need to act quickly on their feedback. Using clean survey data to run your analysis allows you to get to the insights and resolve any issues faster. This will lead to higher levels of customer satisfaction in the long run.

How To Clean Survey Data
Data cleaning can be done in a spreadsheet. However if you're dealing with a lot of data, you'll want to equip yourself with data cleaning tools.
Once you have chosen your tools, the next most important survey data cleaning step is actually knowing what needs to be cleaned.
To clean your survey data you'll need to be aware of the following 6 problems that commonly crop up in survey data results.
1. Time Spent Answering the Survey
Most survey tools allow you to see how long your respondents spend answering your survey and give you an average completion time.
If you have people who are taking 30 seconds to answer 20 questions, or a third of the time than the average, you are dealing with what are known as Speeders.
Speeders are people who don't actually read the questions properly or who put no thought into their answers. This can be because they're not that interested, but it can also happen when there is some kind of incentive attached to completing the survey.
You could also have people straightlining your survey.
This is when respondents choose the first answer from every question. It's normally an arbitrary response and if you see this kind of pattern it's most likely that the person has not read the questions properly and that their answers are not genuine.
How to spot speeders and straightliners:
First calculate the average time to complete your survey, then assess all response times against this average in excel or another spreadsheet. You can easily filter and delete the results that seem implausibly fast.
You can also take steps to prevent straighlining and speeding in the first place and save on data cleaning.
This might look like only using one question per page so it's hard to zip through the survey without proper thought, or simply looking at your questions to see if they are too long or confusing to read.
2. Duplicates
Duplicates can easily happen when someone accidently clicks the submit button too many times as a page loads or inadvertently fills out the surveys multiple times.
These issues are easy to spot when you order your results.
If you see duplicate email or IP addresses it's likely that you'll need to remove or consolidate the responses to avoid the results of your data becoming skewed.
Here's an example that shows a clear duplicate:
| Email address | How satisfied were you were your experience in store today? | We'd love to hear more about your experience |
|---|---|---|
| davisgfsssss@hotmail.com | 2. Unsatisfied | You didn't have the item I needed in stock |
| ss2457@gmail.com | 4. Very satisfied | An assistant approached me and helped me find the product I needed |
| ss2457@gmail.com | 4. Very satisfied | An assistant approached me and helped me find the product I needed |
| jjarviiiis@me.com | 5. Extremely satisfied | I was in and out with what I needed in 5 minutes, no lines, helpful staff |
3. Outliers
Outliers are entries or answers that fit so far out of the range that they're not valuable to analyze.
For instance, if you are surveying 18-34 year olds and a 56 year old fills out the survey, you should discard those responses.
In this example David Jones is the outlier in a survey that was meant for the female gender only.
| Name | City | Gender | Do you hold a bachelor's degree? | If so, what year did you graduate? |
|---|---|---|---|---|
| Florence Fred | Atlanta | Female | Yes | 2007 |
| Zoe Guy | San Francisco | Female | Yes | Didn't graduate |
| David Jones | San Francisco | Male | Yes | 2018 |
| Annie Lewis | Los Angeles | Female | No | Didn’t graduate |
Outliers can also be fields that go against common sense or don't seem plausible.
An example of this would be if you asked people how much water they drink in a day and someone answered that they drink 24 liters, or if you asked how many weekend trips they took in 2021 and they answered 60.
Seeing as it would be dangerous to drink that much water and there are only 52 weekends in a year, you'd know to delete these responses straight away.
There are a number of statistical equations you can do to find outliers, which can then be depicted on something like a box plot or scatter plot for easy identification.
4. Nonsense Data
This kind of data might look like a bunch of random letters or symbols. A respondent may have accidentally entered this or entered it on purpose to quickly advance through the survey for aforementioned reasons.
Either way, you should delete this data if it is not obviously decipherable. Leaving it in just adds confusing noise to your survey insights.
Nonsense data will be found in your open-ended responses, so you'll have to filter by these responses to review and delete where necessary.
5. Missing data
Missing data can happen when your customers skip past certain questions. This can happen for a range of reasons, some of these include:
- A lack of engagement on behalf of the respondent
- Your survey was too long
- The pages took too long to load
- They weren't equipped with the right knowledge or experience to complete the survey
Whatever the reason for the missing data, there's no way of guessing how they may have answered, and their missing results can actually add bias to the overall results. This means you should filter for blank questions and delete these fields completely.
If there are gaps it can also call into question the integrity of their other answers. You'll need to judge whether you should delete all of their responses or just the missing fields.
6. Inconsistent Responses
If the respondent has not answered consistently this could suggest that they weren't weren't paying much attention to filling out the survey or weren't interested in filling it out in the first place.
Examples of inconsistencies include when a respondent contradicts themselves during the survey. An example of this would be if they said they didn't drink coffee in one question, then said their favorite drink was a latte in another.
Or if they said they were unemployed yet drove to the office every day.
It's impossible to trust the information given here as it is contradictory. In order to prevent this bad data from reaching your insights, it should be removed.
If we look at our earlier example we can see that Zoe Guy has provided inconsistent responses. She states she has a bachelor's degree in one answer but that she didn't graduate in another answer.
| Name | City | Gender | Do you hold a Bachelor’s degree? | If so, what year did you graduate? |
|---|---|---|---|---|
| Florence Fred | Atlanta | Female | Yes | 2007 |
| Zoe Guy | San Francisco | Female | Yes | Didn't graduate |
| David Jones | San Francisco | Male | Yes | 2018 |
| Annie Lewis | Los Angeles | Female | No | Didn’t graduate |
To identify inconsistent responses you can add double filters. Using the example above, the first filter would be for people who hold a bachelor's degree. The second filter would be for people who selected that they didn't graduate. Anyone who remains once these two filters have been applied has answered inconsistently.
There may be inconsistencies that are less stark, in this case, you can decide whether it's necessary to weigh these up on a case-by-case basis.
Your Survey Data Is Clean & Ready to Analyze
Once your data is clean, you'll need to make sure you have the right tools to analyze your survey data.
For closed-ended, quantitative answers, or a limited amount of open-ended responses, you can probably get away with using Excel and some manual processing.
However when you receive thousands of open-ended responses, you'll need the help of automated tools like MonkeyLearn.
MonkeyLearn can help you analyze your survey data and draw out insights in a matter of seconds with the help of AI and machine learning technology.
We offer no-code, low-code and ready-to-use templates which automatically run techniques like sentiment analysis and keyword extraction on your survey results.
You'll also get an data visualization dashboard where you can see all your results and insights in real time.


Don't let all your hard work cleaning your survey data go to waste.
Book a demo with MonkeyLearn today to see how you can maximize your survey insights.


Inés Roldós
February 22nd, 2022
Posts you might like...


Text Analysis with Machine Learning
Turn tweets, emails, documents, webpages and more into actionable data. Automate business processes and save hours of manual data processing.
Try MonkeyLearn


