Learn How To Code Open-Ended Survey Questions

When harnessed correctly, survey results can lead to big improvements, both for your customers and for your bottom line.
A fundamental step in the survey process is analyzing the open-ended responses from your customers or employees.
If you don't, you stand to miss out on a lot of useful information.
Coding your survey results is therefore key.
Coding, or sorting your survey responses into categories, allows you to organize your text data in a logical way.
This makes it easier to draw out insights that can inform important business decisions.
In this guide we'll go through what survey coding is and show you how to code a questionnaire.
Finally, we'll reveal how you can visualize your qualitative results.
Feel free to jump ahead to the section you're most interested in:
- What is Survey Coding?
- Survey Coding Approaches -- Which Is Best?
- 4 Survey Coding Tips to Keep in Mind
- From Survey Coding to Data Visualization
- Auto-Code Your Surveys The Easy Way
Firstly, What is Survey Coding?
Survey coding is where you review all of your open-ended, qualitative responses, identify themes or commonalities, and then sort them into categories or groups using tags.
Coding your survey data is really a form of analysis in itself. But it's just the starting point of your analysis journey.
The end goal of coding your survey results is to have organized information which you can then further mine for important insights that tell you more about your customer or target audience.
Survey Coding Approaches -- Which is Best?
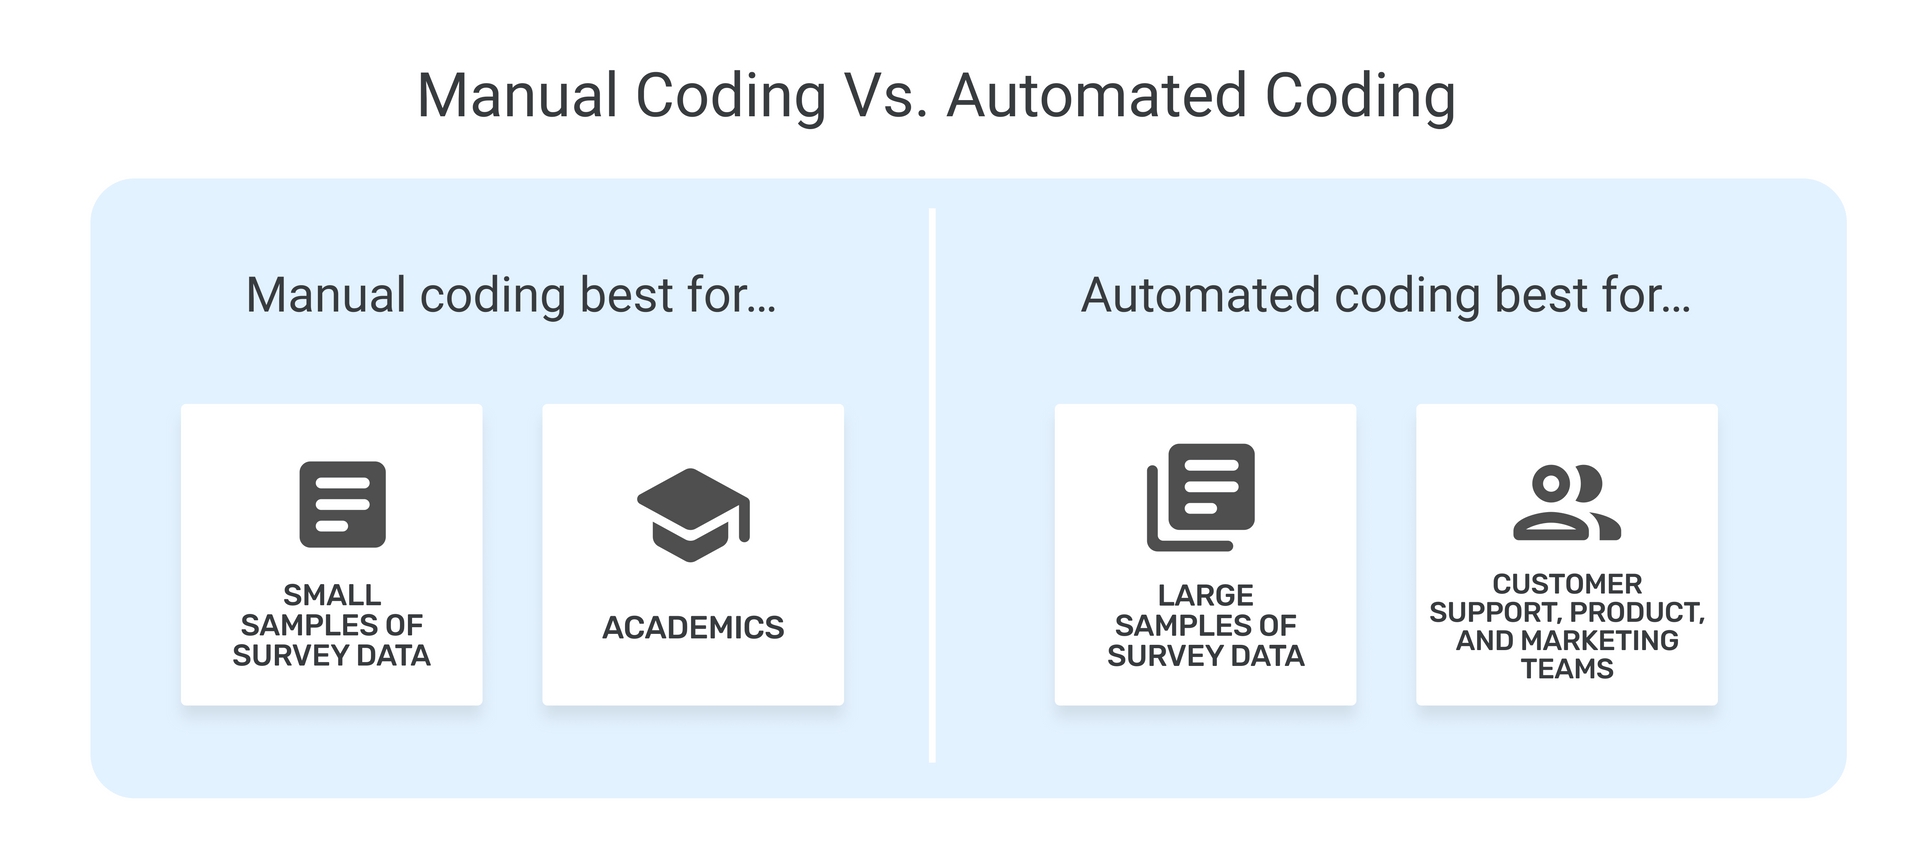
There are two main ways you can code survey responses. These methods are manual coding which you do alone and automated coding where you enlist the help of AI. Here we'll look into how both methods work, the pros, and then the cons.

Before we begin, it's worth noting that you don't have to choose one or the other. In many cases the two can be combined. For example you can automate your coding but still do manual quality control checks as the AI works, or once it's finished.
It's also important to know that automated coding is really only any option if you have around 10,000 plus responses. This is because automated analysis tools need a certain number of text samples to learn from.
Whichever way you choose, you'll find some great survey analysis tools out there to help you.
Manual Survey Coding
Manual coding in its purest form is a process which involves a human reading through every open-ended survey response and deciding which category it falls into according to its content. That human would then assign a tag to the response and it would be officially coded.
This type of coding has been around for a long time in qualitative research fields. There are a number of qualitative analysis tools like NVIVO and MAXQDA that you can use to manually code. You can also use good old Excel to analyze your survey data.
Within manual coding there are two avenues you can follow:
- Inductive coding
- Deductive coding
Inductive coding is where you begin with a blank slate and derive all of your codes from the data as you explore it.
With deductive coding however, you begin with some guidelines or a "codebook" already in place to steer the coding process. This codebook or annotation handbook is normally established from an initial review of the data or from your research requirements.
Manual coding is still a favored method by many academics. Particularly those who work with smaller data sets and like to read through all of their data and responses.
Pros of manually coding surveys
With manual coding you are always close to your data and can read every last word if you want to. This means that you potentially won't miss anything, and can perceive any nuances in the responses.
Cons of manually coding surveys
If you have large amounts of survey responses it's impossible to manually analyze everything.
Even if your data set is a size where you can code it manually, or if you have a team to help, manual coding can be a repetitive, tedious task. It also may not be the best use of your researchers or data experts' time.
If you try to code all of your data manually, you run the risk of missing things --- we are human after all.
As a human you also bring your own opinions and feelings to the table which can result in subjective conclusions. All this leads to inaccuracies in your data, which means your insights may be skewed.
Automated Survey Coding
Automated coding, as the name suggests, is when you make the tagging and grouping of your survey results automatic. This is done with the help of Natural Language Processing (NLP) and machine learning algorithms.
Automated coding is an excellent approach if you have a lot of survey data and you want to code it quickly and effectively.
Open-source libraries can be useful if you want to create your own program to tag and code your data. You can also use ready-to-go tools like MonkeyLearn.
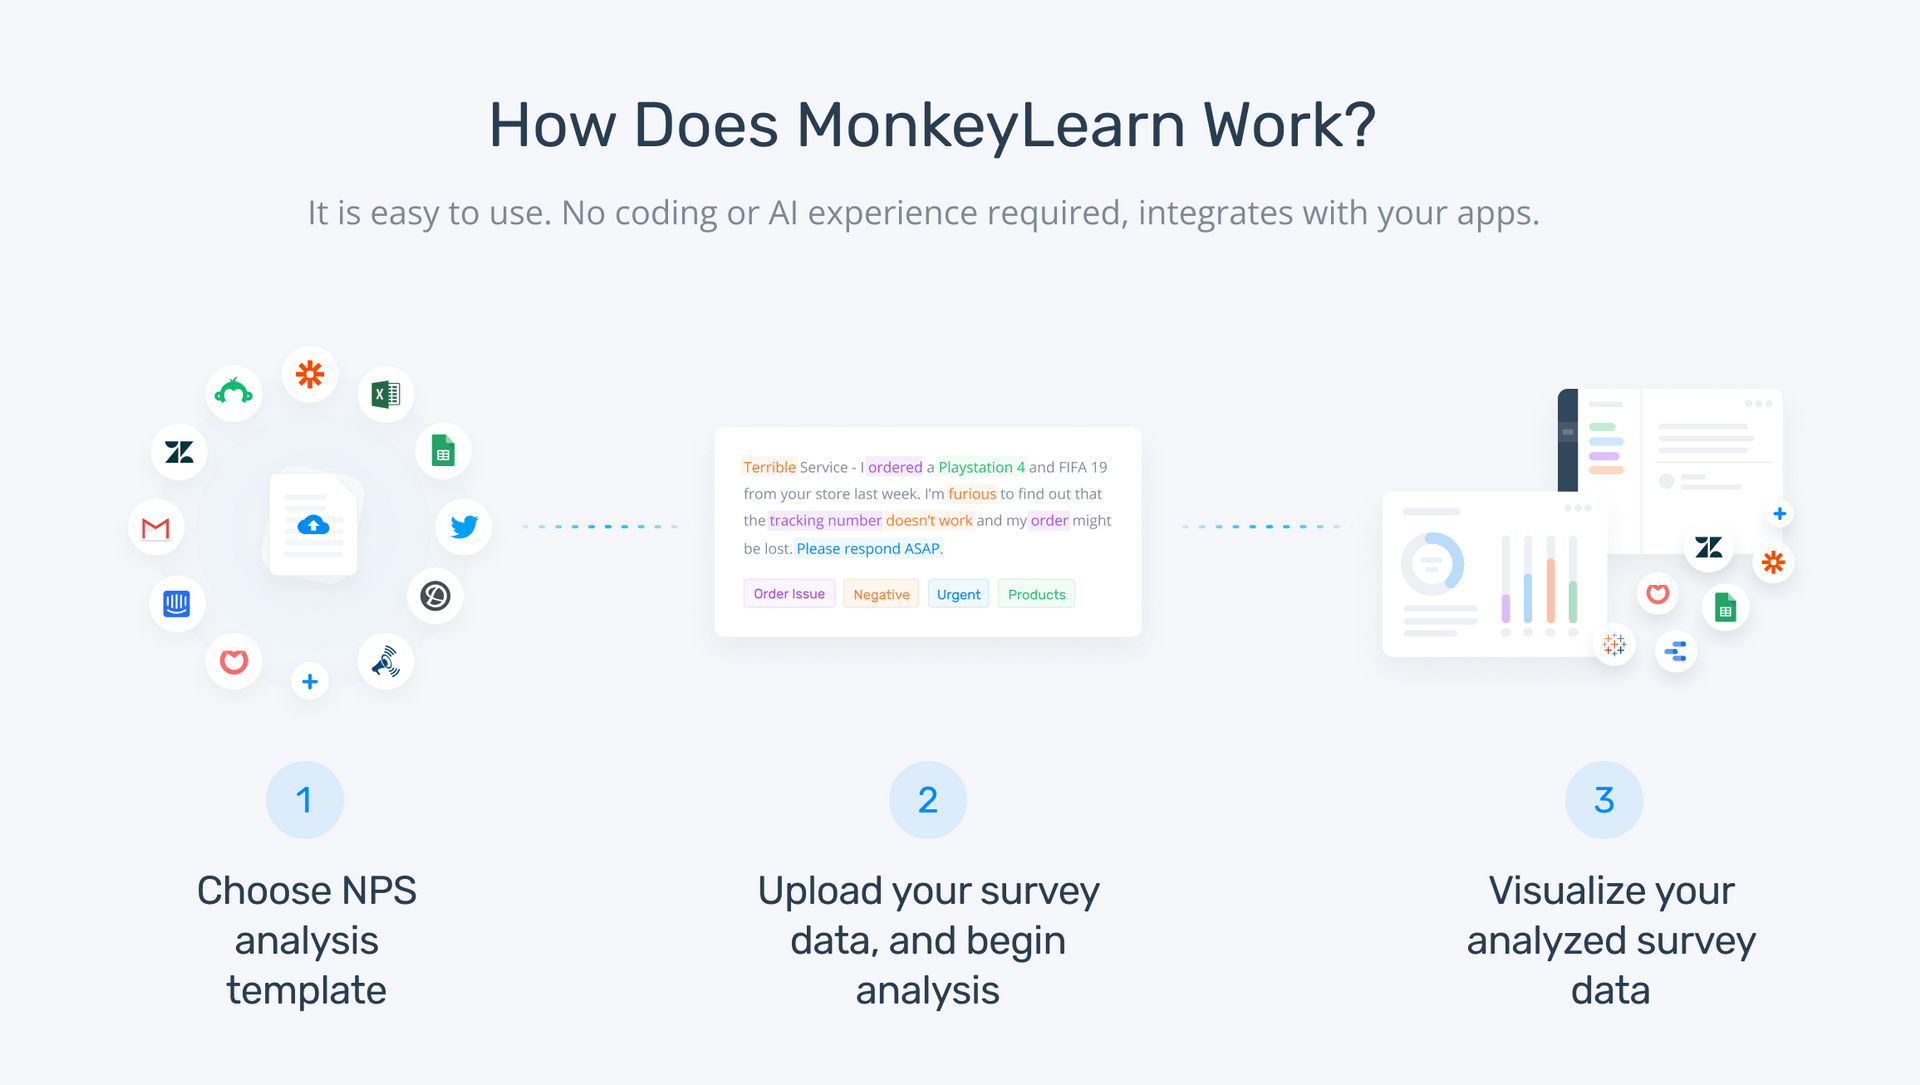
MonkeyLearn offers no-code text analysis templates that can run your survey data through various text analysis techniques like sentiment analysis, topic analysis, and keyword extraction.

All you have to do is upload your data and wait for MonkeyLearn to categorize or code your survey data in ways that make sense for your goals. You can define these categories alongside MonkeyLearn's data science team.
Want to learn more about automatically coding your survey responses? Book a demo with MonkeyLearn.
Pros of automatically coding surveys
Automatic coding is simply the only way to go if you have a lot of data. It ensures effective results that are free from human error and human subjectivity. It's also a fast process, and seeing as time often equals money, this is an indispensable quality.
Cons of automatically coding surveys
You are one step removed from your data with this kind of processing. While it can be argued that automatic processing helps you get to the information that matters more efficiently, some people are more comfortable reading through every response.
4 Survey Coding Tips to Keep in Mind
Regardless of how you choose to code your survey results, there are some principles that you should stick to.
Here we'll go through 4 tips for survey coding:
1. Don't make assumptions
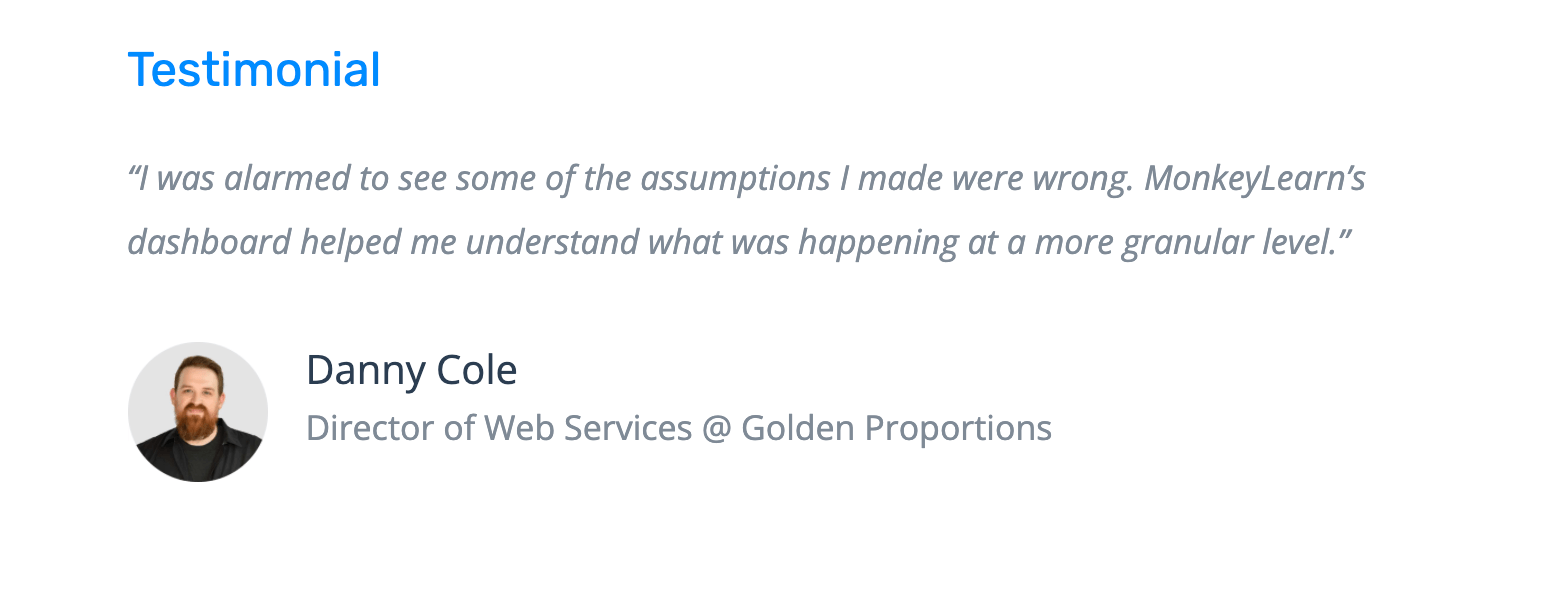
You should always start your analysis with an open mind. If you go into it with a subjective opinion of how the results should turn out, you might miss something, or add your own bias to the results and insights.
You need to make sure that your categories are defined based on actual data rather than your assumptions about the data.
Because your assumptions might just be wrong! Take a look at this client testimonial:

2. Define categories that can be used consistently
As you work through tagging and coding, it's best to maintain well-defined categories with clear guidelines or an annotation handbook.
This means making sure that there are no overlapping concepts between them, each category should be unique and distinct.
This is important because if your tagging is inconsistent or if you have tags that are similar but not the same, your human annotators or automated tagging tools will get confused. And this will affect the accuracy of your insights.
Here's an example of how you might define your categories in an annotation handbook:

3. Keep categories to a minimum
You want to avoid spreading yourself too thin because this will dilute your insights and make it harder to draw conclusions.
Therefore you should aim for a maximum of 10-15 categories. If there is a category that seems too small or is too niche you can remove it or see if it could fit into an existing category.
4. It's an iterative process
Your tagging work will evolve over time and new tags will probably appear as your data grows. Your codes will probably be broader at the start, then as you go through your data, you will be able to tighten up the categories and add new categories over time.
From Survey Coding to Data Visualization
Once your survey data is coded and ready for further analysis, you need to think about how you are going to visualize this information. Visualizing your data allows you to spot trends, patterns, or any outliers.
Strong data visualizations make it easier to come to conclusions and inform important business decisions. They're also more practical and accessible than raw data or text reports when it comes to sharing with team members and stakeholders.\ There are a number of data visualization tools that can help you. A popular, accessible choice is Microsoft Excel. With Excel you can easily see your coded survey results plotted along a bar chart, pie charts, scatter plots, and more by choosing from the insert menu.
Here's an example of a visualization in Excel:

MonkeyLearn also offers in-app data visualization capabilities. Once you've uplodad your survey data to one of MonkeyLearn's plug-and-play templates, you'll automatically receive the results in a dashboard.
Let's use the NPS analysis template as an example.
Learn more about NPS analysis, or continue scrolling to see MonkeyLearn's NPS analysis dashboard.
Just upload your data, then MonkeyLearn will analyze it and deliver a dashboard that you can filter by sentiment, topic, keyword, NPS category and much more.
Ta-da! Here's a snapshot of MonkeyLearn's dashboard:

Want to see how you can create your own dashboard? Sign up for a demo today.
Auto-Code Your Surveys The Easy Way
Coding is an essential piece of the data analysis puzzle, without this step, your analysis would be chaotic and difficult to manage, and useful insights would be potentially lost.
What you will need to decide however, is whether you go down the manual or automated route. This decision will depend a lot on the amount of data you are working with in the first place.
If you have a large amount of data, chances are your only real option will be the automated route in order to maximize both your survey results and your time.
Tools like MonkeyLearn can help you make this process easier and let you focus on the insights you get out of your analysis, rather than the nuts and bolts behind it. Sign up for your free demo today to see how you can streamline and automate your survey coding process.

Rachel Wolff
February 7th, 2022


