Survey Analysis Examples: How to Draw Insights From Survey Data

Survey analysis is the cornerstone of any competitive customer experience campaign. But making best-possible use of their survey data is where businesses often fall short.
It's not enough to just ask the questions -- you have to know how to make sense of the answers when they come back.
This crash course in survey interpretation will outline the steps to better your survey analysis game, regardless of your industry.
Doing so will not only lock in longtime customers, but also make your services all the more attractive to new adopters.
The bottom line is that... your bottom line increases when your customers are happy. And deriving useful insights from survey data is the key to making sure that they are.
We'll get into exactly what survey analysis is. Then, we'll expand on the different varieties of survey data before moving on to step-by-step how-to's as well as some of the best survey analysis software you can bring in to empower your teams -- and even more tips to getting the most out of your results.
Feel free to jump around the article by clicking through the list below. Otherwise, off we go!
- What is Survey Analysis?
- Why Perform Survey Analysis?
- Types of Survey Data
- How to Analyze Survey Data
- Best Survey Analysis Tools
- Survey Analysis Best Practices
- Takeaways
What is Survey Analysis?
Survey analysis is the process of transforming the results of surveys into insights and answers that you can use to make the right business decisions.
Why Perform Survey Analysis?
There's no point on sending out surveys if you don't analyze the answers -- answers that could be key to improving your business.
This answer may seem obvious but businesses often forgo the analysis step, especially when they're met with huge amounts of survey data.
But that's a BIG MISTAKE. Digging into your survey responses can help you understand your customers' qualms, so that you can cater to those worries and needs, whatever they may be, and keep your customers satisfied.
According to the Harvard Business Review, satisfied customers not only stay with a company for five years longer, they also spend 140% more.
Furthermore, understanding survey feedback can help you attract new customers and continue to provide positive experiences for existing customers.
Bain and Co found that a 5% increase in customer retention correlated to a 25% increase in revenue.
So what's holding companies back from analyzing their surveys?
Not having the right tools.
When you have huge amounts of survey data to sift through, you need the right tools on your side -- especially if you have a large number of open-ended survey responses. Now that's a different kettle of fish to close-ended responses.
So, before you start analyzing your survey data and choosing which tools to use to help you, you have to identify the kind of data that you have.
Types of Survey Data
Survey data comes in two varieties: open-ended and close-ended responses.
Both have their advantages and disadvantages.
To elicit close-ended responses, you ask a close-ended question, phrased in a manner that can be responded to on a scale, between 1 and 10 for instance, or by clicking 'yes' or 'no'.
They are 'close-ended' in that this is the end of the question -- the user doesn't need to fill out any reasoning behind their choice, they just need to click.
These three most common surveys always ask an initial close-ended quantitative question:
However, for greater depth and insight, the close-ended question is often paired with an open-ended question.
The free-form open-ended responses you receive to these questions will unlock the 'why' behind the data you are getting from the black and white close-ended question.
This is the classic dichotomy between quantitative (close-ended) data and qualitative (open-ended) data.
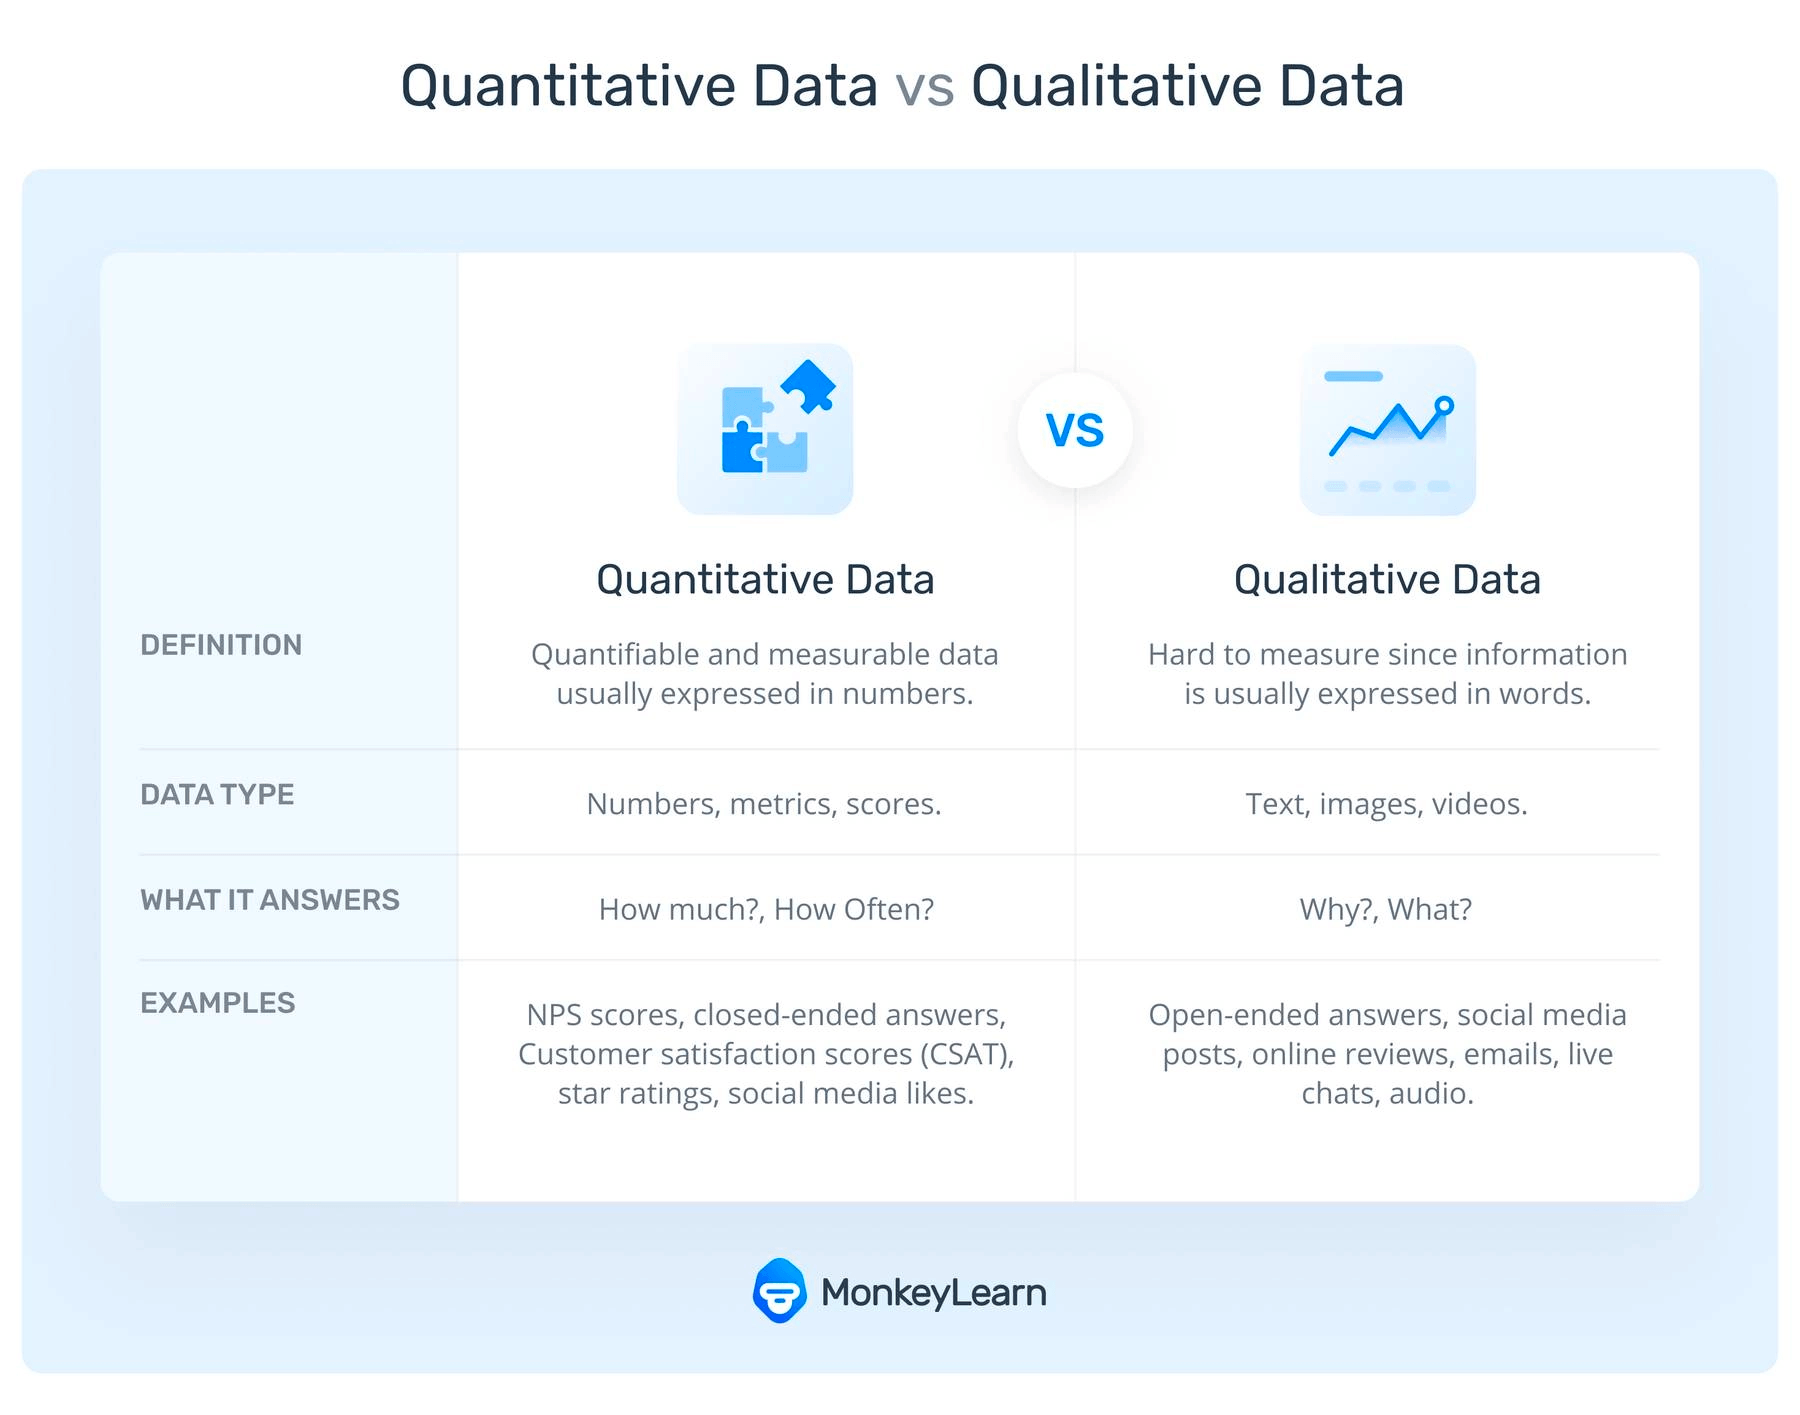
The trick is to ask both close-ended and open-ended questions in your surveys so that when you analyze your survey results, you get:
- High-level insights from the close-ended question
- Contextual insights (that explain the numbers) from your open-ended data.
Let's walk you through exactly how this can be done.
How to Analyze Survey Data
Let's break the survey analysis process into some key steps, then dive into each, starting from the top with raw, unstructured survey response data. Our steps will be:
- Interrogate your 'big question'
- Filter and examine close-ended survey results
- Analyze open-ended survey responses
1. Interrogate your 'big question'
Here, we approach the inevitable part of any guide where they tell you that you've been thinking about the whole thing wrong from the jump.
While that isn't necessarily true in this case, carefully choosing (or re-examining) what you are looking for with your survey campaign is critical to downstream success.
The first step should always be to make sure you know what you want answered. This might seem obvious, but make sure your target question addresses the need your teams decide is most in need of fixing.
This could mean focusing on long-term customer retention, like asking repeat customers who have reached out to support teams how their interactions went. Or, it could target new adopters, asking them, for instance, what drew them to your service in particular.
With your target goal locked down, you'll be ready to dive head-first into the close-ended question.
2. Filter and examine close-ended results
Here we get to the nitty gritty. Once you've imported your survey data to data analysis tools like Excel, you can filter it and draw initial insights. For example, you can cross-tabulate your survey data, which basically means slicing and dicing using filters.
Cross tabulating is a popular filtering technique that breaks down your responses by customer segment. Essentially, you are isolating demographics, like age, gender, location, business size in order to identify demographic trends hidden within your data.
Take, for example, this set of responses we gathered when asking "How likely are you to recommend Monkeylearn WordCloud to a friend or colleague?" Here's the dataset in totality:

Now, our first cross tabulation move could be to filter by device -- we filter by 'phone' and we derive:
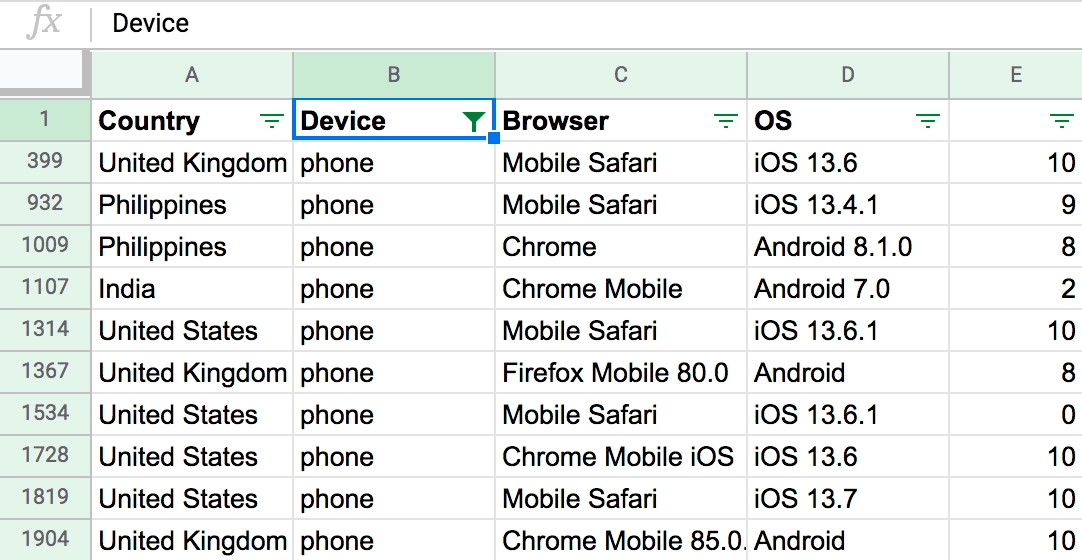
Then we stack on another filter, in this instance we sorted by device 'desktop' and browser type 'Safari':

See that '4'? We have an outlier! By sorting through this cross section of our data, and isolating all the responses below five we can identify a data trend.
Proactive CX teams follow this kind of trend down the rabbit hole -- into the open-ended data 'why' data behind it. They identify where there's a problem, then excavate what the problem is with the attached open-ended data.
So, let's see what that looks like.
3. Analyze open-ended survey responses - 4 Examples
Here the rubber really meets the road as we unpack the harder to reach data hidden within respondents text responses. There are four approaches to analyzing these survey responses.
- Manually code survey responses
- Outsource survey response analysis
- Generate a word cloud
- Automate survey analysis
1. Manually code survey responses: If you don't have a lot of open-ended survey data to analyze, manual analysis is your first step as you grow. Just remember to try to stay objective and limit the number of different eyes with different standards going through your responses.
Manually going through open-ended data is exponentially more difficult and easier to mess up when you're dealing with large datasets (5k+ entries).
It's not only difficult, but rife with reader bias.
Text analysis is a delicate art, and it's hard for the workers doing the reading to follow any objectivity guidelines -- there will inevitably be some subjectivity in their tallies, compromising your survey analysis goals.
2. Outsource survey response analysis: Some businesses may opt to send their open-ended data out to be assessed by a third-party. Unfortunately, this is only recommended as a last resort.
There is no way that a third party can be as clear on your teams 'target question' as you are, and you cannot assure absolute objectivity if the third party is analyzing manually, no matter their promises. And they won't be as familiar with your customers' language and business terms as you are, especially if your business is highly specialized.
Finally, if the third party is going to apply automated survey analysis software, why not do this yourself? In doing so you will assure that all your business software are integrated and will be able to make outcome critical pivots at your own discretion.
3. Generate a Word Cloud: Here, we dip our toes into the first of our two recommended techniques for analyzing your survey data. Word clouds are a great, simple, jumping off point that, like the cross-tabulation performed earlier, can give us clues as to trails we need to follow within our data.
Take, for instance, this word cloud of the customer service interactions of a financial institution:

As you can see 'Account' and 'Customer Support' stand out both in the cloud and percentage wise. They could then apply the previously mentioned cross-tabulation technique, and filter to view only replies relating to 'Account'.
All account related replies could then be further spliced by device used to access, browser type, country of origin, etc until clear subgroups who consistently deliver low ratings are identified.
4. Automate survey analysis: Word clouds are just the tip of the iceberg when it comes to the power of true, AI-empowered, automated survey analysis.
Fully equipped text analysis suites, like MonkeyLearn, are capable of inputting, processing and transforming the open-ended results of survey campaigns into quantitative data that's easy for all your teams to understand.
Note: It is worth mentioning that text analysis tools can't work with extremely small sample sizes -- there just isn't enough data for machines to learn from.
MonkeyLearn takes your open-ended responses and parses them through a series of text analysis tools, like sentiment analysis, topic analysis, and keyword extraction... Leaving you with results that look something like this:
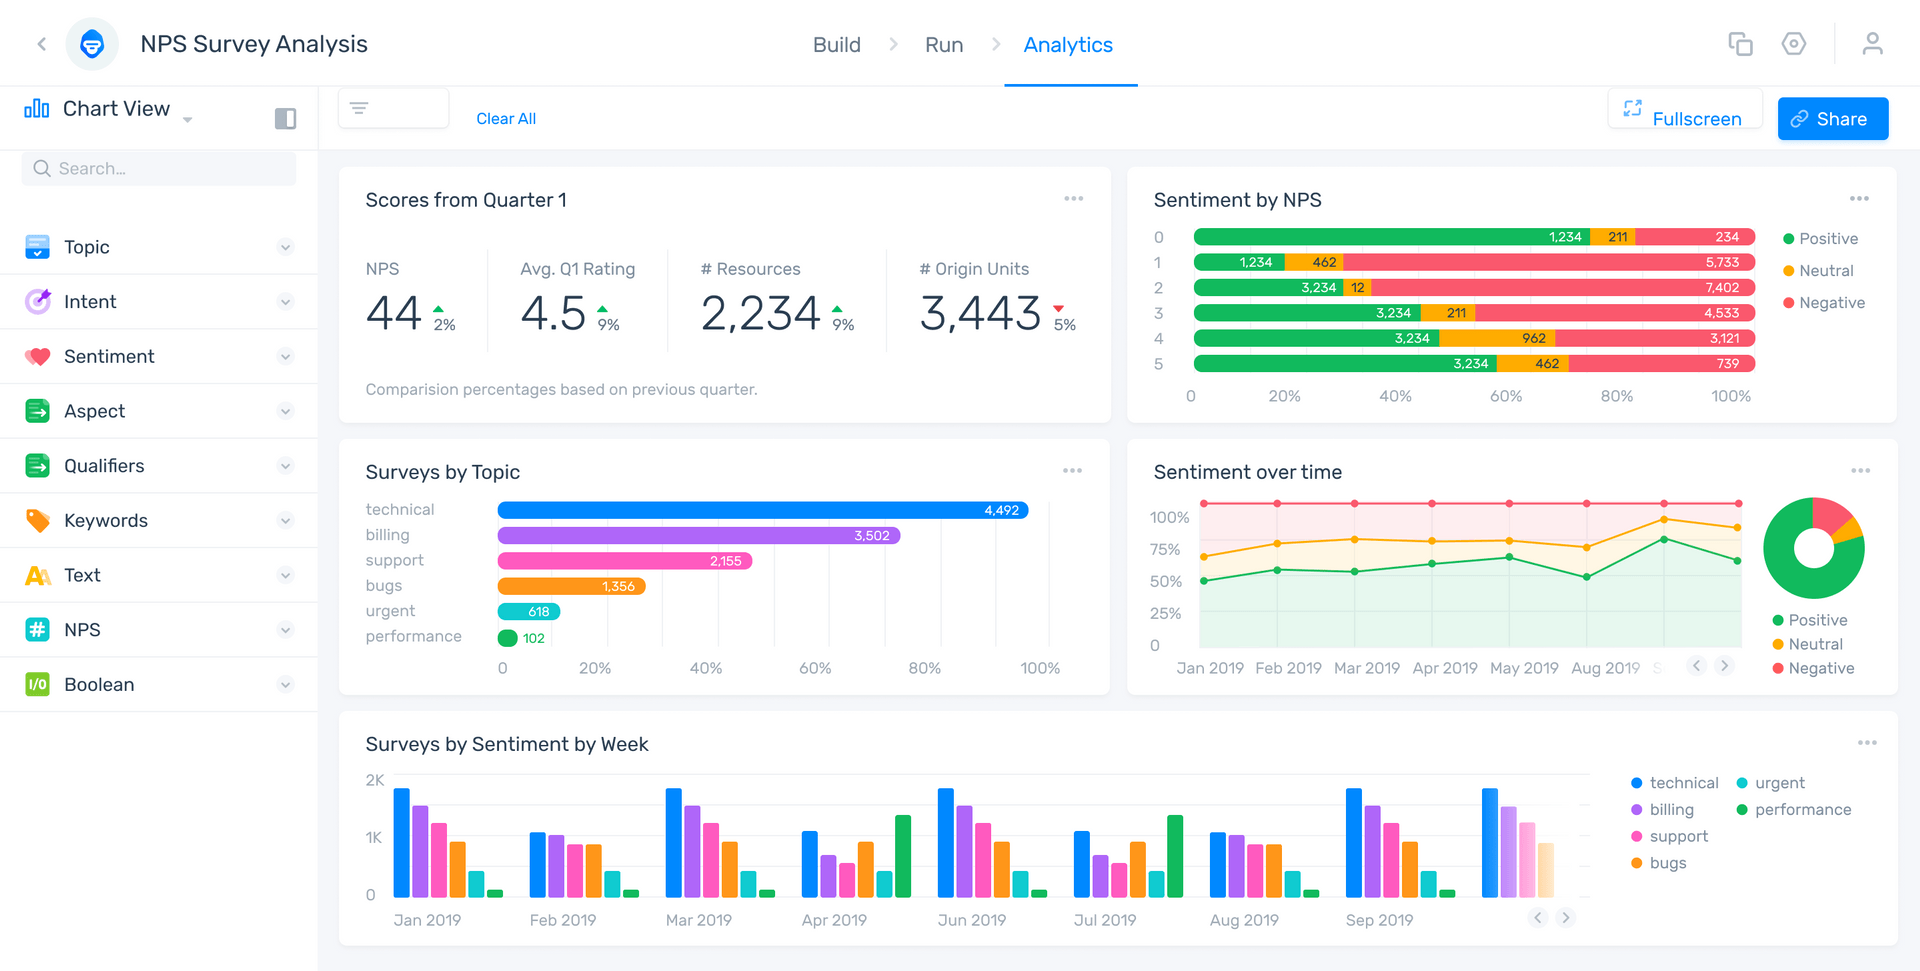
Want to find out how to transform your survey results into insights like this? Book a demo with MonkeyLearn and we'll show you how easy it is to do.
In this way, the power of machine learning AI makes open-ended, qualitative data as easy to read as our close ended data. Even better -- it unlocks deeper insights than close-ended data, allowing you to draw out specific updates you need to make to improve your customer service, brand messaging, and products.
Best Survey Analysis Tools
The best survey analysis tool is the one that best fits your business. The marketplace offers tools for companies with different approach levels and needs, so finding the right tool for you is a matter of self-assessment then making the right choice.
We've highlighted the three best tools out there, all of which excel in different areas. Take a look.
- NVivo - Best for entry level
- MaxQDA - Best for mixed media
- Monkeylearn - Best for deep analysis
Nvivo - Best for entry level
Marketed for researchers and academia, NVivo can make a great first survey analysis suite because of its usability, compatibility, and easy-to-use transcription software.
Its platform's backbone is built on SPSS, a statistical modeling software, and uses this to filter and manage your data once you've uploaded. Pair this with quick and easy to generate data visualizations, and you are well on your way to deriving useful automated results.
MaxQDA - Best for mixed media
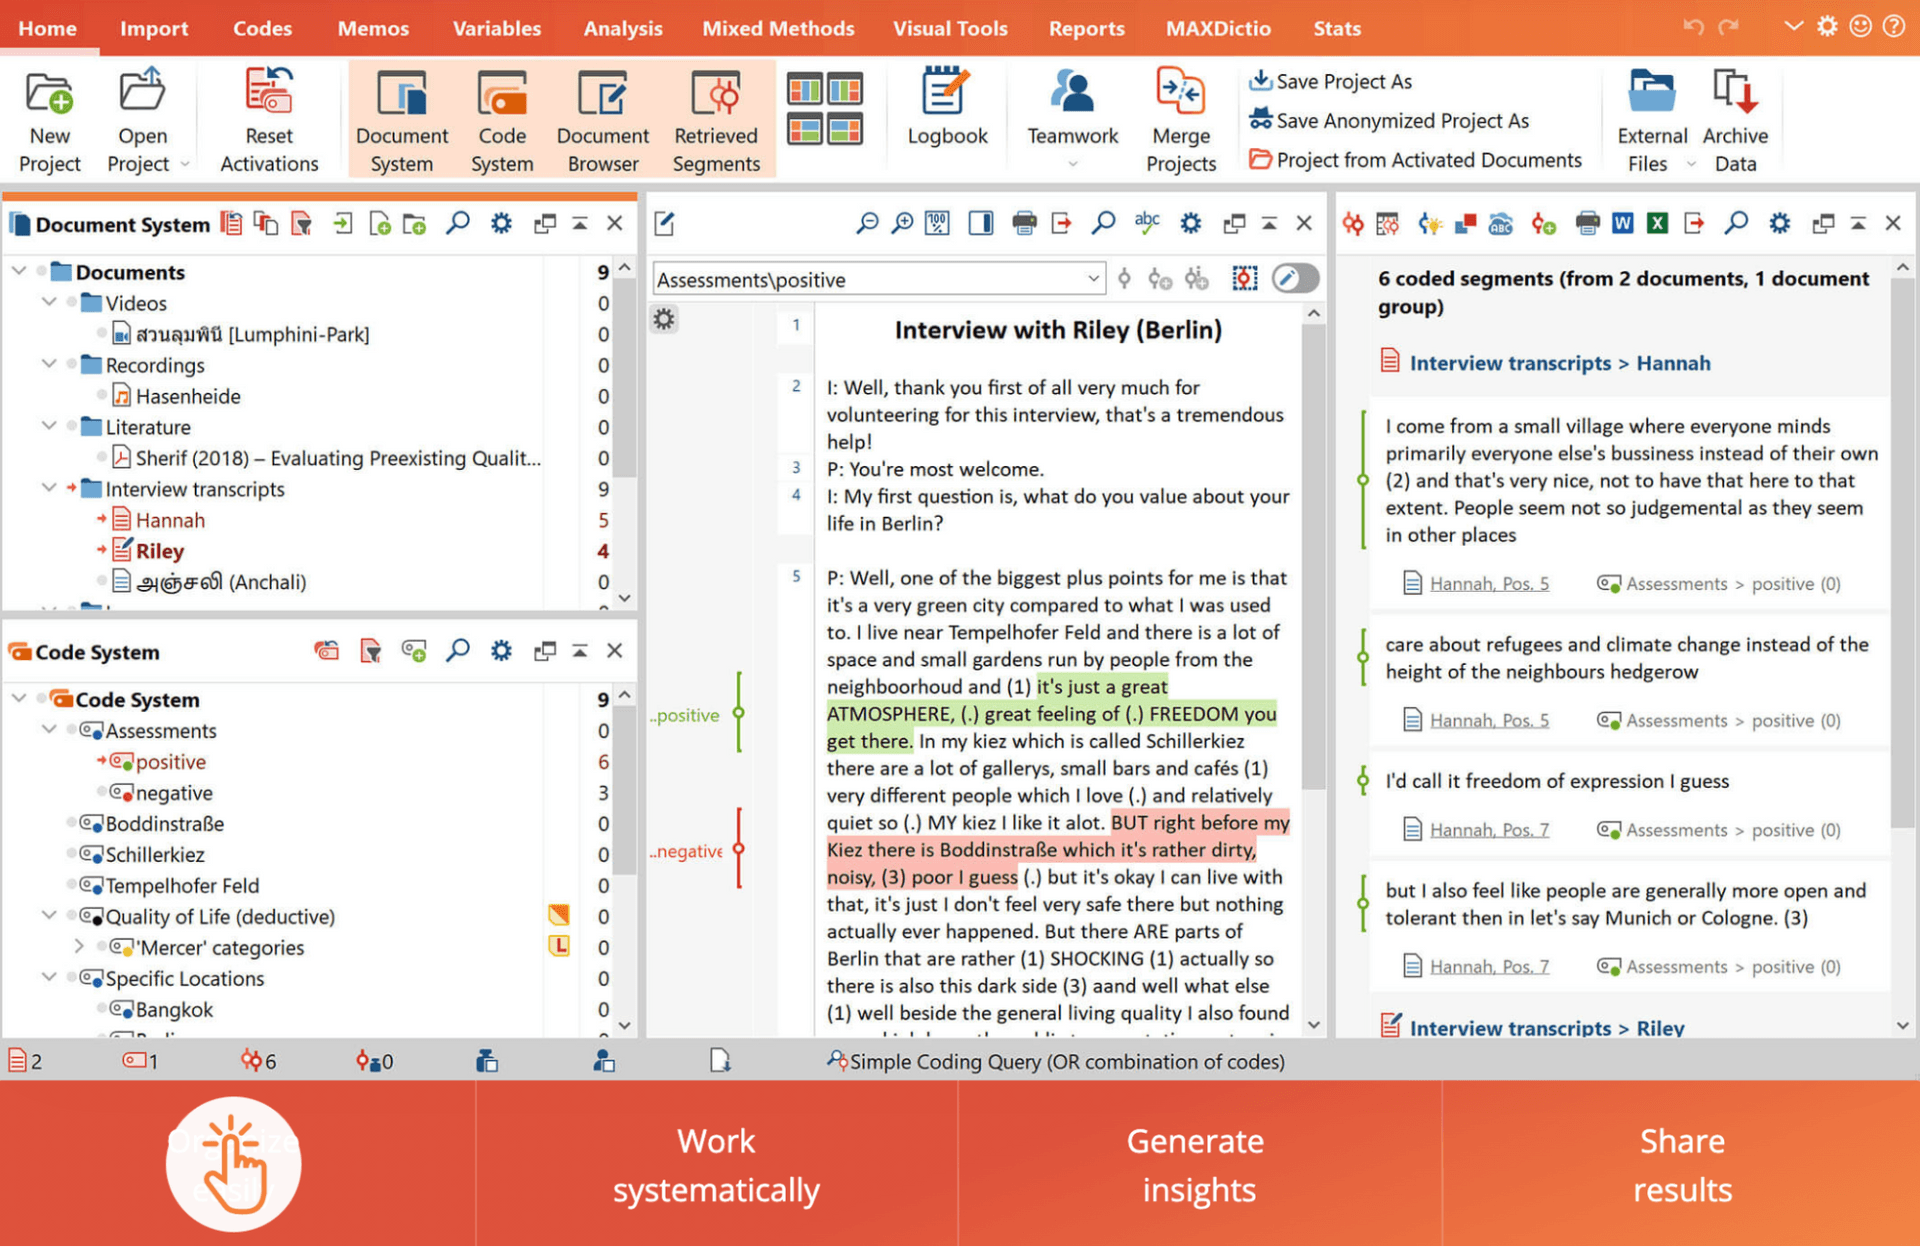
MaxQDA markets themselves as world-leading 'mixed method' analysis software and it's clear why. Their suite, while also sporting all the organizational and data input bells and whistles, is built to handle input from a plethora of sources.
They name texts, images, audio/video files, websites, tweets, focus group discussions, survey responses as the baseline of their capabilities.
IF you're a company that gathers customer feedback in a variety of forms and have been stymied by a lack of ability to translate on other platforms, MaxQDA might be the tool for you.
Monkeylearn - Best for deep survey analysis
We've already shown off our suite, but Monkeylearn's true strength lies in the power of its artificial intelligence, as well as its supplemental benefits with a focus on key business integrations.
That is to say -- our AI is a world leader when it comes to power, and, armed with our results, we play well with other software.
Additionally, our software is designed to meet the needs of both businesses that want pre-built templates (see our NPS analysis template below) that will work out the box, and for businesses who want to custom build their analysis software.

Combine our API integration, our top-of-the-line AI, our flexible building modalities and you already have a comprehensive package.
Add on top a cutting edge insight-driven Word Cloud generator, and an open coding library and you have a survey analysis platform that can handle any business's needs just as well as any other option, just with more in-depth capacity.
Then, we bundle this all into a beautiful and comprehensive data visualization dashboard.

Survey Analysis Best Practices
There are a few more techniques to make sure you execute your survey campaign well from start to finish. Let's dive into some of those best practices before you jump into analyzing your surveys.
- Check your assumptions.
- Calculate statistical significance
- Compare customer data sources
- Question your survey structure
- Take action and close feedback loops
1. Check Your Assumptions
You'll only truly know your customers if you listen to them. That means analyzing the open-ended responses to your survey questions. If you skip this step, and make assumptions about the data from your close-ended responses, you could end up making the wrong decisions.
Hear it from one of our own customers:
2. Calculate Statistical Significance
Many great campaigns have yielded skewed results due to a lack of accounting for statistical necessities during distribution. Making sure you have a large enough sample size and that participants are selected using fair probability sampling are necessary to obtain clean, unbiased data.
Re-checking your Statistical Significance accuracy using a sample size calculator is an easy fix that can prevent easy-to-miss statistical and sample size skewing of your survey.
3. Compare customer data sources
Making sure your data is diversified is a key qualifier for an accurate survey. If, say you are getting all your responses from one survey delivery method, your other method might be broken or inaccessible for other reasons.
Or, if you aren't getting data from a certain geographic region that you know you have customers in, it's best to check what happened to your data, as taking in a zero for the region will spoil all of your results.
4. Question your survey structure
Your survey's 'structure' consists of its format, delivery, and phrasing. Making sure all three are aligned and considerate of your target question is the best way to great execution.
5. Take action and close feedback loops
This last step is left undone at your own peril -- making sure actual action is taken in response to your survey. Make sure your teams are data trained enough to make the most of your insights to close feedback loops so your problems stay solved. Easier said than done, but feedback without action is a waste.
Takeaways
Seems like hard work right? Absolutely. But, while not alway easy, great survey analysis is precise survey analysis. And precision requires constant maintenance of one's approach.
No matter where you are on your path to customer experience excellence, it's important to measure your progress incrementally. Measure where you started, then apply the best-suited tools and slowly measure growth.
When it comes to tools, Monkeylearn has you covered.\ Book a demo and have a custom fit survey analysis suite built for you by one of our experts, or jump right in and build your own with a free trial.

Inés Roldós
February 9th, 2022


