CSAT Analysis: How to Analyze CSAT Surveys and Improve Scores

When it comes to long-term business success, reducing customer churn and keeping your customers happy, have proven to make the most difference.
Satisfied customers spend 140% more and stay with a business four years longer on average according to a recent Forbes study.
So, customer satisfaction is the name of the game - and CSAT, the key to improvement.
In this cheat sheet we'll go through the basics of how CSAT works, outline what CSAT is good for and how to improve your score. Finally, we'll walk you through how to analyze your CSAT responses.
Feel free to click ahead to the CSAT analysis section.
- What is CSAT?
- Calculate CSAT Score
- Pros & Cons of CSAT
- Open-Ended CSAT Questions: Getting the Most Out of Your Data
- CSAT Analysis: Getting the Most Out of Your CSAT Data]
- Takeaways
What is CSAT
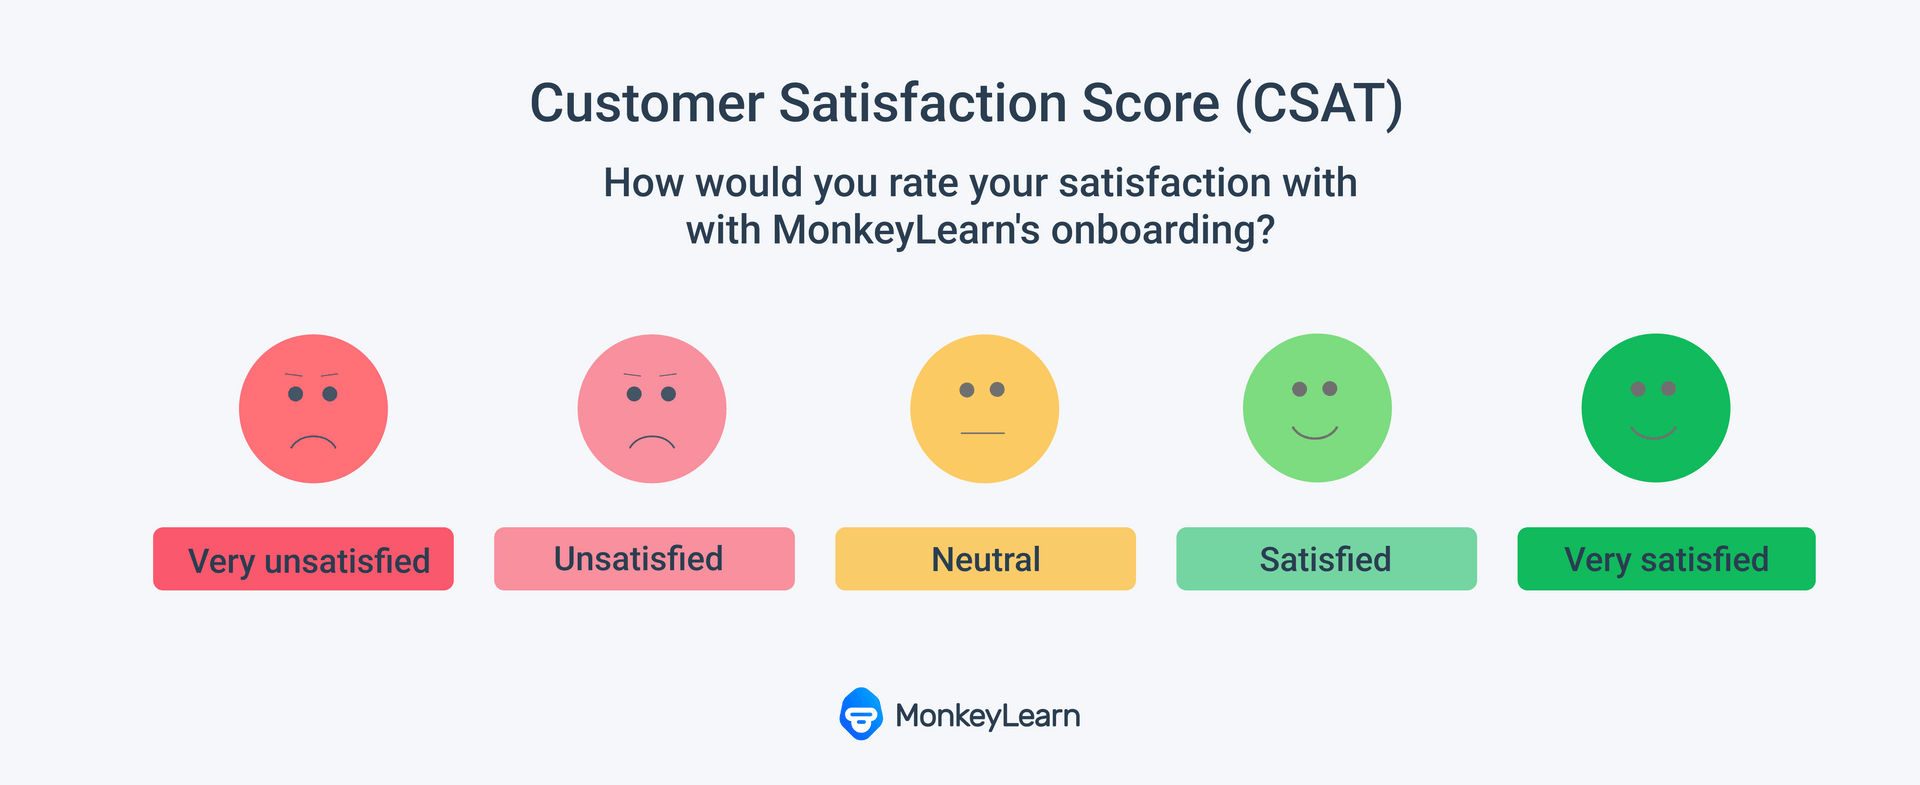
CSAT surveys ask a direct question about how satisfied customers are with their experience with your company.
Whether sending CSAT surveys by email, having them pop up in-app, or in a live chat, they are asked at a touchpoint (e.g. following a purchase, after a customer service interaction) your team deems is in need of a temperature check.
Example CSAT question:
"How satisfied were you with your recent (interaction, purchase, upgrade, etc)?"
Then, respondents will pick on a scale from Extremely Unsatisfied to Extremely Satisfied. CSAT is most commonly measured on a 5-point or 10-point scale, but other variations exist.
What is The Difference Between CSAT, NPS and CES?
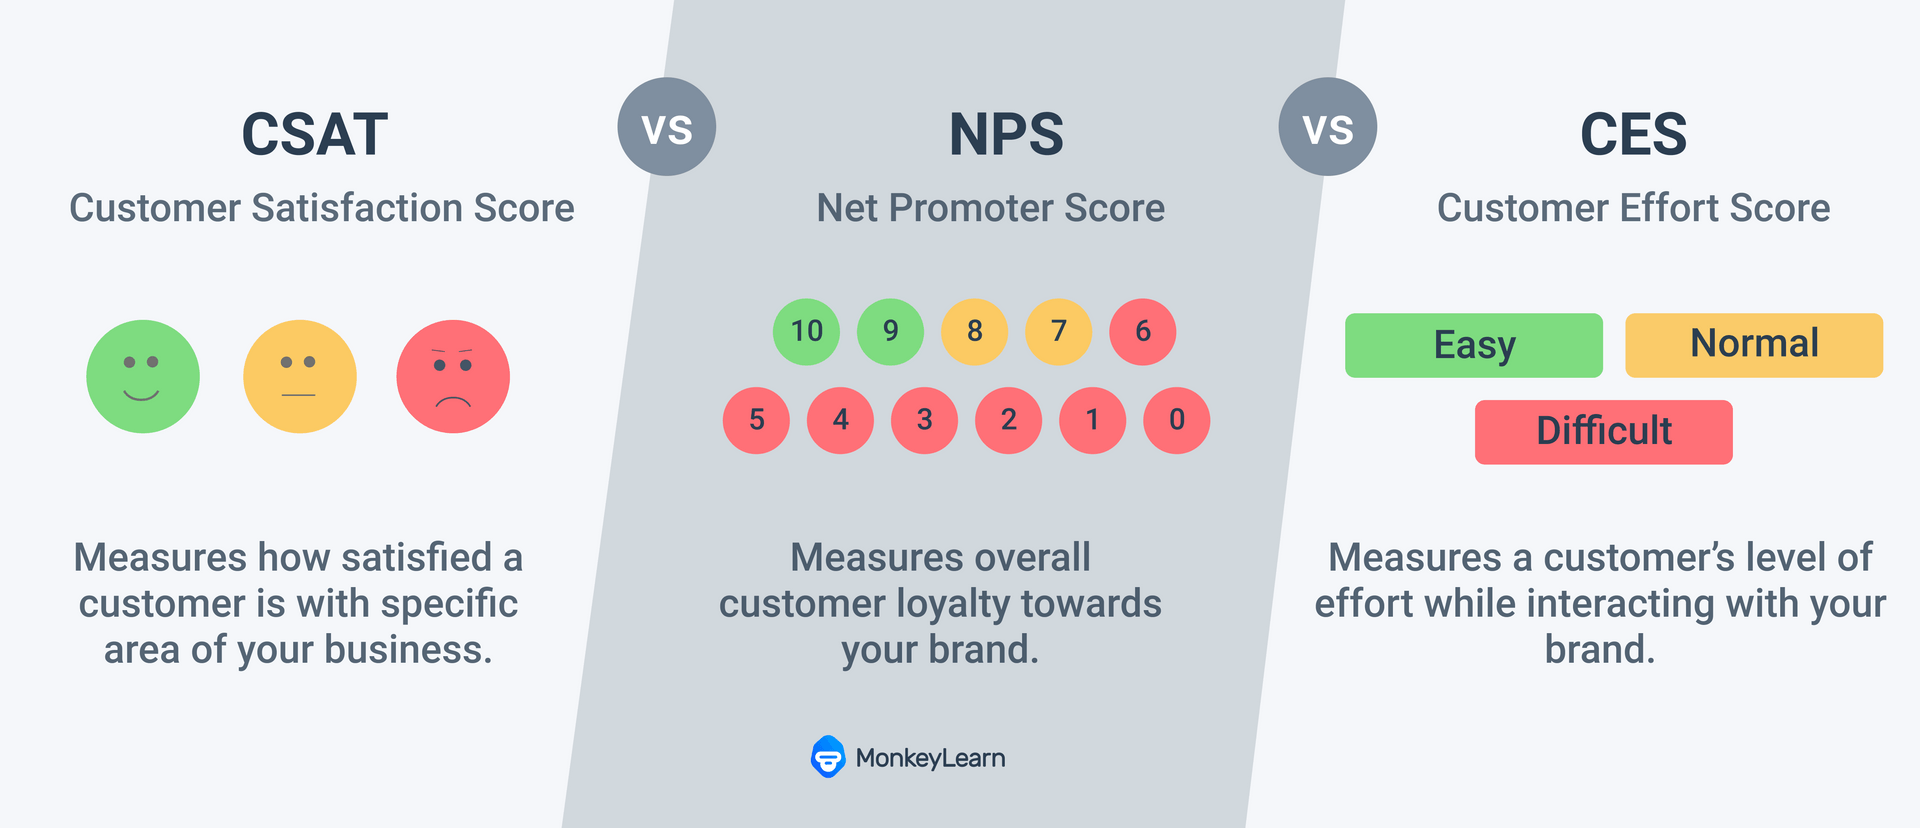
Even though CSAT, Net Promoter Score (NPS) and, Customer Effort Score (CES) are all measures of customer satisfaction, they all have a different purpose.
CSAT gives micro level insights on customer satisfaction with a product or service, whereas Net Promoter Score gives macro level insights on customer loyalty with your company. On the other hand, Customer Effort Score measures how easy it is for customers to use a product or service or resolve a problem.
Calculate CSAT Score
Once you have your CSAT responses, in order to derive a CSAT score, you'll need to perform some basic math.
Take the number of respondents who responded Positively or Extremely Positively with scores of 4 or 5, and divide that number by the total number of respondents.
Then, multiply that number by 100 and there you have it, your percentage of satisfied customers. Here's the equation:

For, example if 100 people took your survey, and 75 gave you either a 4 or 5 out of 5, your score would be 75.
CSAT Score: (75/100) x 100 = 75
What is a Good CSAT Score?
If you are doing this for the first time you will certainly have questions at this point. You have a number but what exactly constitutes a 'good' CSAT score?
Well, that depends. Because it is a touchpoint measurement, meaning it measures sentiment at an exact point in time, CSAT scores are most useful when used as benchmarks.
You can track your progress by comparing your current scores to your past.
However, there is some agreement on a few basic terms.
First of all, businesses should look at CSAT scores in the context of the industry they are in. The American Customer Satisfaction Index (ACSI), who makes this kind of thing their business, found that the average CSAT score in the U.S. in 2021 was 73.6%.
Now, say your business is in Finance and Insurance and you get a CSAT of exactly 75% - you might think that's a good sign, but it actually falls beneath the industry average of 76%.
Even greater disparities exist. The Luxury Hotel Industry, for instance, enjoys high enough scores (Hilton 83%, Marriott 80%) that hotel chains make them part of their advertising campaigns. The opposite is true for hard-to-please industries like Hospitals at 70%, or Television Subscription Services (aka Cable) at 65%.
Point being - your personal 'good CSAT score' can be achieved through measuring CSAT with the context of both industry and time (benchmarking).
Pros & Cons of CSAT
Let's run through some of what makes CSAT great and where it falls short as a measurement of customer satisfaction. We'll expand on each below.
CSAT Pros
Ubiquitous
CSAT scores have become standard in the customer experience industry, as one of the three big customer satisfaction measurements (the other two being NPS and CES). That means it's easy to find data against which you can benchmark your score.
Simple to fill out, simple to calculate
On its face, the CSAT question as posed above is simple, and the response range is easy to understand. Customers like this, and this has contributed to CSAT surveys enjoying famously high response rates.
On the employee side, the CSAT equation can easily be programmed to automatically calculate in real time, so you can see how your survey campaigns are doing up to the second as they are distributed.
Data is easy to process
The quantitative data from CSAT surveys is quite simple and can be easily analyzed with any number of statistical tests for clear results beyond the obvious single number.
CSAT Cons
Data lacks depths
Measuring CSAT without an open-ended question attached to your CSAT survey is like sailing without a compass. You may know where you need to go but don't have the information you need to help you get there.
The CSAT score alone is nothing if you don't know why you got it.
Adding open-ended questions allows customers to make up for CSAT data's lack of actionable depth by asking the 'why' behind their score. By gathering all of their why's and analyzing this qualitative data in depth your teams will be pointed in the right direction, and able to sail towards feasible improvement, and increased satisfaction.
Self-reporting bias, single respondent bias
When it comes to your raw CSAT score, it is also prudent to watch out for a couple of natural, customer-side, phenomena. Self-reporting bias occurs because customers are more likely to respond to a survey if they have had a polarizing (extremely good or bad) experience.
It's human nature to want to be heard after you have had something work or not work. But these customers absolutely must be listened to in order to close feedback loops and continue to satisfy already happy and loyal customers - doing so can make a massive difference in long term brand loyalty
Single respondent bias is the sometimes unavoidable situation where the respondent is speaking for a whole team or household. Maybe someone else had a very different reaction to your product and isn't being heard.
Keeping these pros and cons in mind, let's move to the heavy-lifting: revolutionizing your CSAT campaigns with effective in-depth analysis.
CSAT Analysis: Getting the Most Out of Your CSAT Data
A CSAT survey without an open-ended or follow-up question can yield hollow results.
CSAT will leave you with a score that locates yourself amongst your competition - exploring this score, for instance understanding why CSAT scores are low amongst customers at a certain part of their journey - say a specific step of the checkout process - could point you directly towards an area for improvement.
Open-ended analysis helps you expand on your CSAT score.
When it comes to actually doing all you can to improve your customer experience, and by virtue of that, your CSAT score, you'll need to look into the insights that come from asking customers why they left the score they did.
In the following CSAT breakdown, we'll show you how to dig into the quantitative data in your responses, then introduce you to more advanced CSAT analysis that involves analyzing the open-ended text responses.
Let's get our hands dirty and walk you through, step-by-step, how to perform quantitative and qualitative CSAT analysis.
CSAT Analysis Steps: Breaking Down Your Survey Results
In this CSAT analysis, we are going to use the example of the Financial Institution that scored a 75% CSAT from before to walk you through how to go about acting on feedback.
As you might remember, their score is 1% below the industry average of 76%. Meeting that average would be a worthy goal, and improving even as small as 1% requires hard work and attention to detail with customer bases of significant size - small gains prove significant in the long run.
We'll go through these four steps to break down and create leverageable insights from your quantitative and qualitative data.
- Examine Data, Isolate Target Group
- Visualize Keywords
- Perform Text Analysis
- Locate Friction Points by Topic
1. Examine Data, Isolate Target Group
First, we take a look at our raw numbers. Knowing that we scored 75% doesn't give us much, so let's examine a bar graph of the number of responses we received in each of the 5 categories.
Here's what the spread from our Financial Institution might look like:
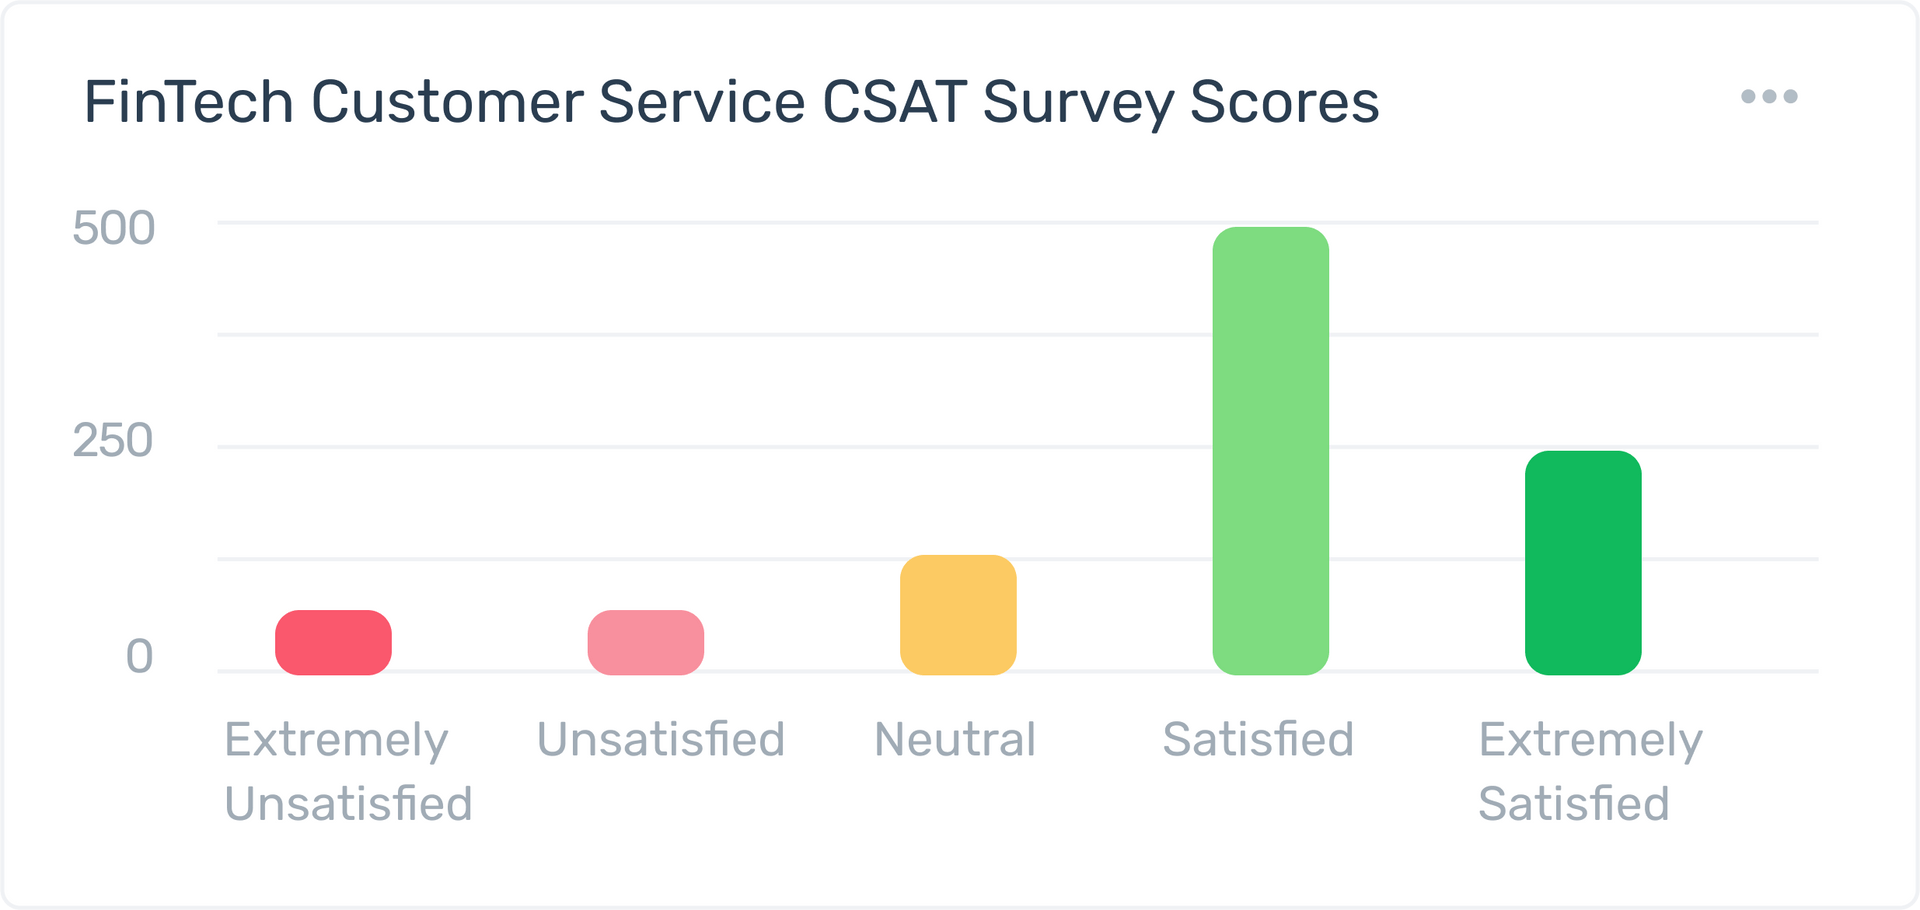
Now we have to decide which of the five groups of respondents to target. We choose the Extremely Unsatisfied and Unsatisfied respondents, i.e. those who responded '1' and '2'.
We target these detractors first and foremost to prevent churn. If their friction points are addressed, they could become satisfied. Or, even better, if their feedback loops are fixed before their very eyes, they might become advocates of the company's customer service team.
First, let's see what we can do by prying open the doors of basic CSAT and taking a look at more detailed data behind it. In this case, we'll chart a simple plot of our 1 and 2 responses, based on the agent the customer service was handled by.
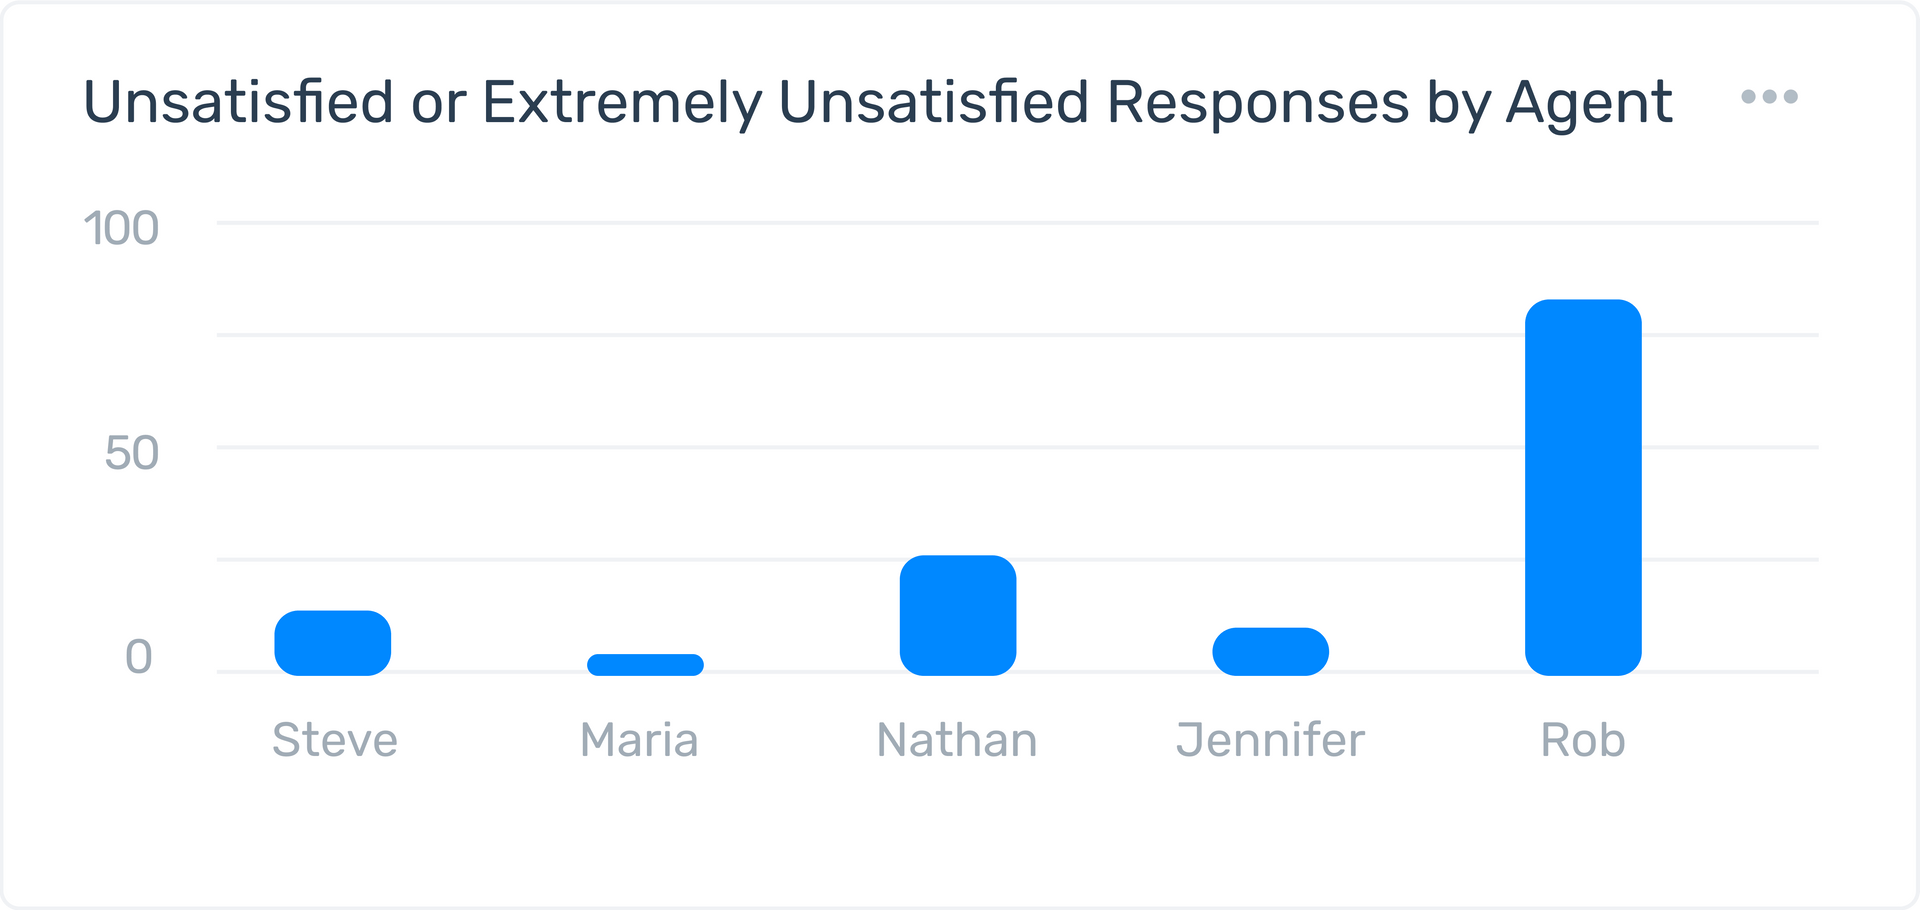
Just with a quick look, we can tell that Rob is generating an abnormal number of unsatisfied responses. By locating an outlier agent, you can retrain or even just remind the said agent of brand voice practices - whatever you think is best to incentivize their improvement.
It may be that he is unhappy with a practice at the workplace - this is where measuring and improving employee NPS can be key to turning a negative trend around.
Having addressed a quantitative friction point we move on to get even more from our survey by checking out qualitative data.
So, we take our range of unsatisfied responses and take a look at the open-ended question responses attached to them.
Now, to derive deeper insight we need to have asked the right follow-up question in the first place. The best thing to ask depends on your product and current needs, but if you're unsure what to ask it is better to keep it broad and open for interpretation. For further guidance on what to ask check out our guide to the top open-ended questions for 2022.
For this example, let's say our Financial Institution asked this simple, service-related query:
"What did you like or dislike about our service?"
This should elicit customer opinion, particularly if they ran into any problems. But, even with the small number of responses we are using in our case study here, that's a lot of data - and most surveys for even mid-sized businesses and beyond would be much, much larger.
2. Visualize Keywords
All that written data would take forever to trawl through by hand. As a first step, to get a quick overview of your text data you can use word clouds.
Word cloud tools make the most common term jump out by literally making it the biggest in the cloud, and so on in order of frequency:

As you can see, 'Account', 'Customer support', and 'FinTech' stand out as key topics discussed by users of this financial app.
3. Perform Text Analysis
We should note that word clouds are just one dataviz option, and not always the most accurate because they focus on the frequency of words, and not necessarily their importance.
In order to most effectively make sense of written data, you'll need to employ text analysis tools, like keyword extraction, sentiment analysis, and topic classification.
That's where text analysis tools, like Monkeylearn, shine.
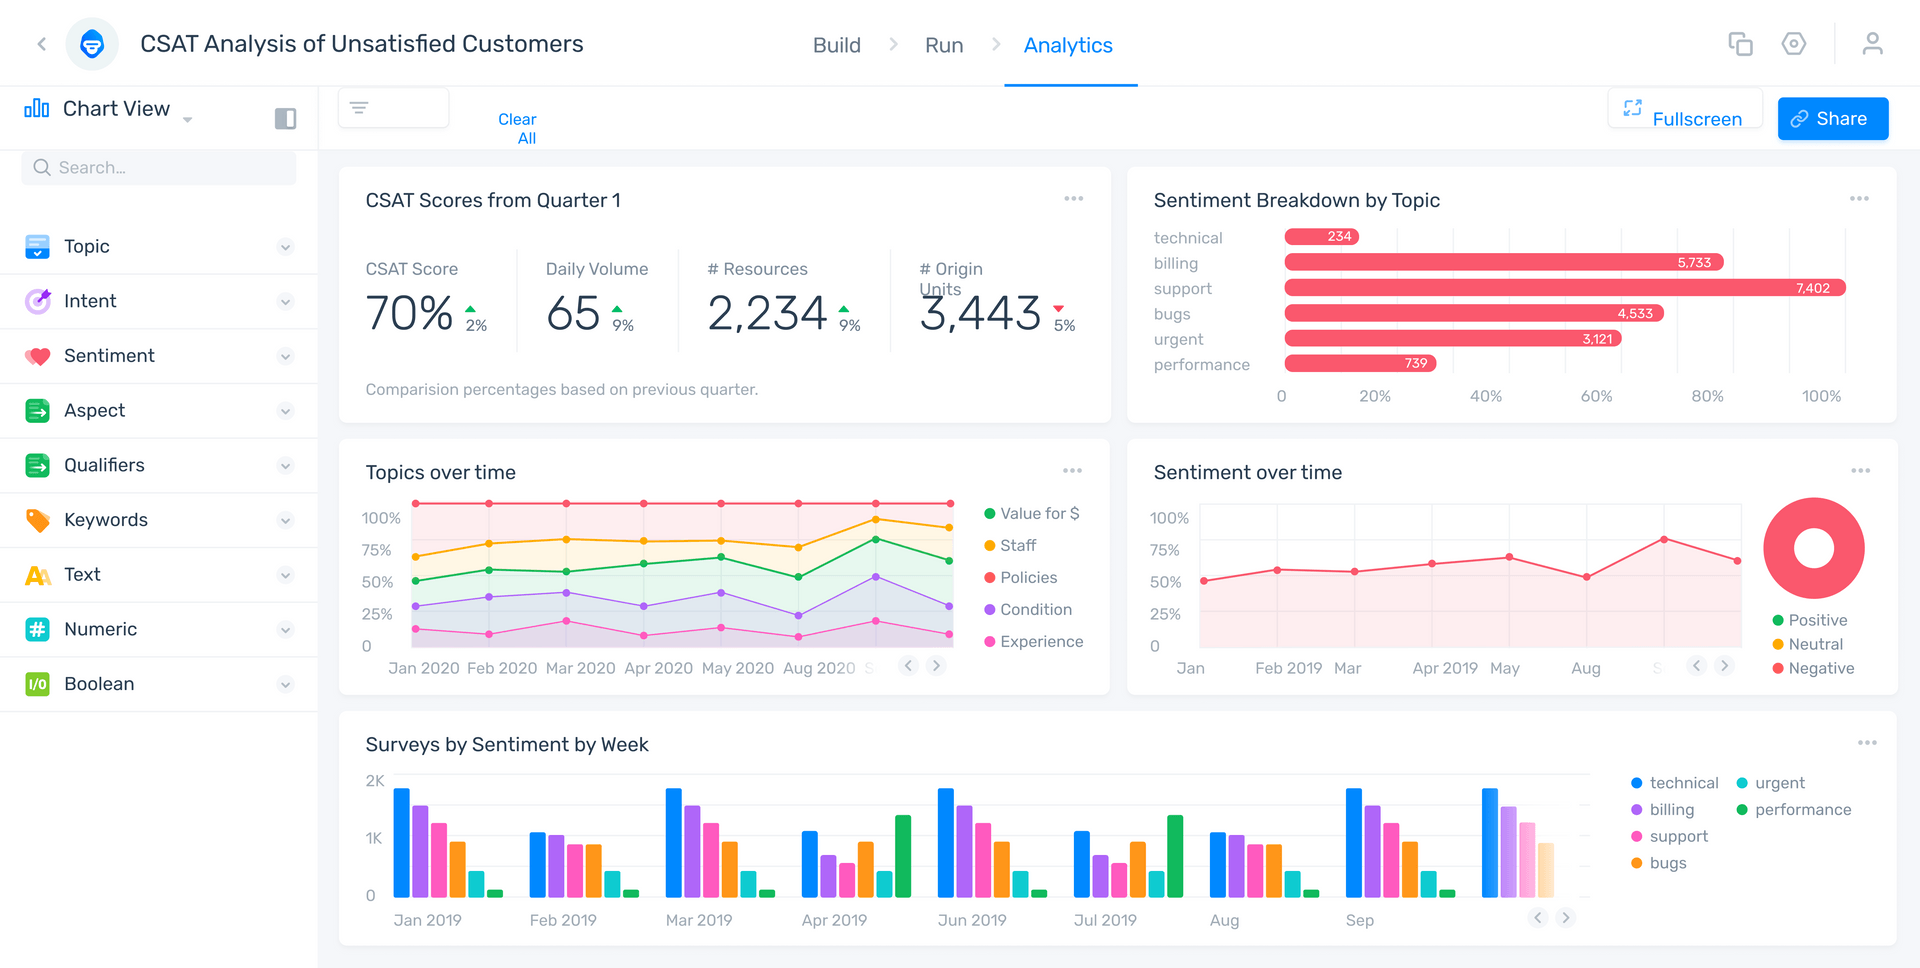
MonkeyLearn has a suite of no-code text analysis templates that analyze, interpret and dissect your data by sentiment, topic, and keyword all at once, to produce quantified insights neatly displayed in graphic and statistical form.
All of this data is neatly tracked and displayed on your own dashboard, which we'll reveal at the end!
So, let's begin this CSAT analysis breakdown by plugging data into MonkeyLearn's templates.
It is as simple as choosing the template from our out of the box options, and uploading a CSV file with all your CSAT responses. Then, you are greeted with your very own custom dataviz dashboard!

4. Locate Friction Points by Topic
To find actionable insights in your data, you can filter your results by comments that have a negative sentiment.
With our data filtered in this manner, you can quantify what aspect of our business is drawing the most negative sentiment, and create a database of the manners in which it is failing.
For example, with this filter you can find the following comment and detect that the finance app has usability issues:

We can then route the different failure modalities to the requisite product and support team managers, and work on fast solutions.
Just like that, with the help of advanced text analysis AI, we've turned a jumble of words into a clear action path forward, with data to back it. That's the magic of asking the 'why' behind CSAT surveys - it allows you to step out and deal with problems rather than passively observing them.
Takeaways
Most businesses sell themselves short by not acting on their CSAT data - don't be one of them. With a large majority of major businesses prioritizing customer experience going into 2022 according to a Zendesk study, doing so can keep you ahead of the pack.
Monkeylearn has all the tools to allow you to do so, with the added benefit of being the most powerful data analysis suite out there. With full dataviz options, an open-source coding library, and widespread API integration to synergize with any existing business software, it is built to supercharge your existing infrastructure.
Book a demo with one of our data analysis experts to see how Monkeylearn could custom fit your business, or jump right in with a free trial.

Rachel Wolff
January 26th, 2022


