

How to Calculate CSAT & What It Means for Your Business


Understanding the customer experience (CX) should always be at the center of everything you do – it’s Business 101
You need to ensure that your customers are content or, even better, enthusiastic about your brand.
While there are a number of metrics to measure customer happiness, like Net Promoter Score (NPS) and Customer Effort Score (CES), one of the most used and most trusted ways to evaluate your customer support efficacy and overall customer experience is by determining customer satisfaction (CSAT).
In this guide, we’ll take you through what CSAT actually is, before getting into the nitty gritty of how to calculate CSAT.
We’ll also reveal how you can quantify your open-ended CSAT responses to help you further improve your CSAT score.
Read along, or skip ahead to the BIG REVEAL!
- What Is a CSAT?
- How Do You Measure CSAT?
- Why Measure CSAT?
- Bitesize Takeaway: Zendesk’s Global CSAT Index Report
- What Is A Good CSAT Score?
- Pros & Cons of CSAT Scores
- BIG REVEAL: How to Quantify CSAT in Open-Ended Responses
What Is CSAT?
CSAT is a customer satisfaction (CSAT) metric that is used to measure the overall performance of customer service based on the customer’s experience every time they interact with a business, service, or product. Customers express their satisfaction on a five- or 10-point likert scale, which is converted to a percentage between 0 and 100 – with 100 meaning that customers are completely satisfied with their experience.
How to Measure CSAT
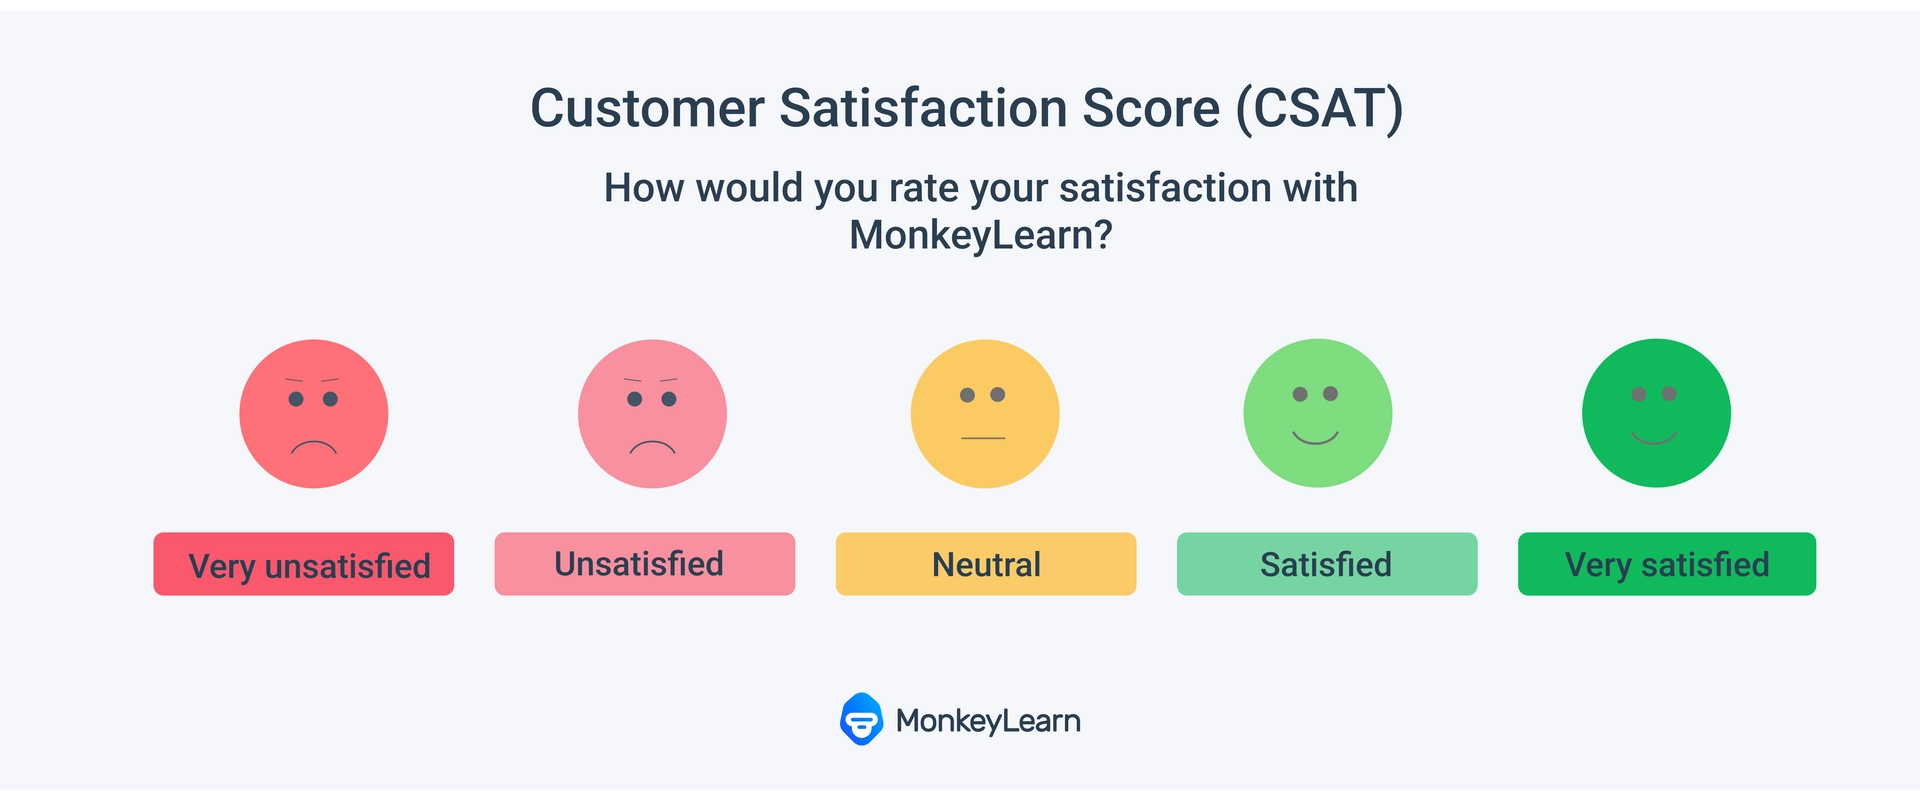
CSAT can be measured once you’ve collected a number of customer satisfaction surveys. Customers are asked a simple question, like:
- How would you rate your satisfaction with (our company, product, customer service, etc.)?
Respondents are then presented with a predetermined set of possible responses: on a scale of 1 to 10 or 1 to 5, represented by “satisfaction levels,” e.g., very satisfied, satisfied, neutral, unsatisfied, very unsatisfied, etc.

Because CSAT scores deal with close-ended, quantitative, or structured data, each response has a corresponding number value, so they’re easy to administer and easy to calculate, with each value expressed as a percentage.
CSAT surveys are often sent via email or they pop up in apps or chats, immediately after a customer interacts with customer service, or at certain customer journey touchpoints, like after purchase or after onboarding. Other places they may appear are on a company’s website, or on in-store touchscreens.
Here's a CSAT survey from Apple, asking customers to rate their level of satisfaction following an order.


Why Measure CSAT?
CSAT scores are a fairly basic calculation of customer feedback and customer loyalty, but they can be a powerful metric for understanding general customer happiness and measuring your business against your competition.
And when it comes to a good customer experience, good customer service is key. Customer support analysis is the main focus of CSAT – it’s a major pain point for many customers, but companies with great customer service tend to outperform their competitors.
For your CSAT score related to customer service, it all boils down to (1) how many support tickets come through your support desk, (2) first response time, and (3) the percentage of tickets resolved.
Your company’s CSAT calculation can help understand where you’re failing your customers. And later, we’ll show you what machine learning can do to transform your customer service feedback into action.
Zendesk’s Global CSAT Index Report
According to Zendesk’s global CSAT index report, 82% of Americans said they’ve stopped doing business with a company due to poor customer service. So, just a single bad experience can really hurt your bottom line.
Zendesk’s CSAT index shows global customer satisfaction at 86%. Australia and Canada lead the English-speaking world at 93% each, with the US scoring 87% and the UK coming in last with 83%.
The global CSAT index by company size (number of employees) shows some interesting data:
| Company size | CSAT Score |
|---|---|
| 1 - 9 | 91% |
| 10 - 99 | 84% |
| 100 - 499 | 88% |
| 500 - 4,999 | 93% |
| 5,000 | 90% |
Small, mom-and-pop businesses have the time to give good customer service because they tend to deal with customers face-to-face and don’t have customer support tickets, per se.
Medium-to-large companies (10 to 500 employees) tend to struggle with customer service, possibly because they have grown too fast, or haven’t sufficiently focused on how it affects their customers.
That means medium-to-large companies really need to hone in on how they can still deliver customer service that meets customer expectations, even as they grow.
The solution involves automated tools, starting with ones that can effectively analyze your customer feedback and transform insights into customer service improvements.
More on how you can do that later with MonkeyLearn.
How to Calculate CSAT
Calculate your Customer Satisfaction (CSAT) score by dividing the positive responses (satisfied customers) by the total number of responses and multiplying by 100, which is then expressed as a percentage.
For example, if you have 50 responses total and 45 are positive, your CSAT would be 90%.


If you asked the question: “Did we help you with everything you needed today?” after a customer service call to 200 customers, with 140 saying “Yes” and 60 saying “No” your CSAT score is 70%:


This is for binary or dichotomous questions: Yes/No, True/False, thumbs up/thumbs down, etc., when customers are only expressing approval or disapproval.
If you are calculating on a number scale, the calculation is slightly different. You add up all of the response scores given, divide by the maximum scores possible and multiply by 100.


Let’s say you asked “On a scale of 1 to 10, how would you rate our customer service today?” to five customers and received these results:
| Customer | Response Score 1 to 10 | Maximum Possible Response |
|---|---|---|
| Response 1 | 9 | 10 |
| Response 2 | 7 | 10 |
| Response 3 | 5 | 10 |
| Response 4 | 10 | 10 |
| Response 5 | 4 | 10 |
| Total | 35 | 50 |


If you’re working with ratings from very satisfied to not at all satisfied or similar, you would simply give each rating a number value and perform the same calculation.
Although not as tied to customer service as most CSAT scores, star rating systems, like you see on Yelp and Amazon work similarly. You simply multiply by 5 instead of 100 because the highest possible score is 5 stars, rather than 100%.


Once you’ve calculated your CSAT score, discover what a good CSAT score is, so you can gauge how well you’re doing on the CX front.
What Is A Good CSAT Score?
That’s a question we hear all the time, and a valid one because CSAT benchmarks differ from one industry to the next.
Overall, a CSAT score of 80% is considered the gold standard for good or very good
To know the benchmark CSAT score for your business, you can refer to resources like the ACSI (American Customer Service Index), which provides benchmark scores for industries, sectors, brands, and companies.
The average CSAT for American companies rose 0.1% from Q2 to Q3 of 2021, to 73.7%, but still remains low compared to previous years over the last two decades.
CSAT scores are designed to give a general view of customer happiness, and shouldn’t be used as a single indicator of customer service performance or business success, but rather, a tool to compare your business against industry standards and competitors working in the same field.
You should keep tabs on your CSAT score on an ongoing basis, to see if there are sudden dips. Since customer service has a huge impact on customer acquisition and retention, you’ll want to quickly understand why your CSAT score is falling and take immediate action.
What Are The Pros & Cons of CSAT?
The main benefits of CSAT are that it’s fast and easy to calculate, and because CSAT surveys generally only ask a single question, you’re likely to get high response rates from your customers. Simply add your CSAT question to your email signature or have it pop up in your app or on your website after a customer service interaction.
CSAT benchmarks, by industry, are readily available, so you can easily see how your business stacks up. And easy data collection and quick results mean you can follow your CSAT as it rises or falls, day-by-day.
Unfortunately, as you’re not necessarily getting responses from every customer, your results could end up skewed. Customers that had a terrible experience, for example, may simply want nothing more to do with the company and will quickly log off or avoid emails.
CSAT also lacks granularity of positivity or negative sentiment. It doesn't explain why customers were satisfied or unsatisfied with their experiences.
But that’s where open-ended responses really shine.
Not every business enables respondents to leave an open-ended response following the simple CSAT question, but here’s why you should: they’ll help you figure out why customers are satisfied or satisfied with their experience with your products or services.
Big Reveal: How to Quantify CSAT in Open-Ended Responses
CSAT scores only give you quantitative information that measures customer satisfaction with numbers and percentages. This data tells you what has happened, i.e., the percentage of your customers that are satisfied with your product or services.
Qualitative data, found in your open-ended responses, on the other hand, can dig into the why behind these statistics. Qualitative survey data analysis deals with open-ended questions that allow the respondent to answer the question in their own words, giving you the data of ideas, feelings, and opinions, and often leading to new information you had never considered.
Because qualitative data is free-form text, it’s harder to analyze – you can’t simply allocate corresponding whole numbers and plug-in formulas.
With advances in machine learning, however, AI text analysis software can structure your unstructured survey text data and automatically mine it for keywords, opinion polarity, categories and themes, and more, for real-time results and qualitative data-driven decisions.
Want to know more? Sign up to MonkeyLearn for free to learn more about what AI text analysis tools can do for you.
MonkeyLearn is a SaaS text analysis platform with a suite of tools and templates that automatically analyze open-ended survey data.
Try out this survey response analyzer that automatically sorts open-ended survey responses by topic.
When performing a CSAT survey for example, you can ask, “On a scale of 1 to 10 how was your customer support experience?”
Then, you can follow that question up with an open-ended question: “What can we do to improve our customer support?” or “How did you experience problems today?”
This gives you both qualitative and quantitative data, so you can find out what happened (good or bad experience) and why it happened.
With MonkeyLearn, you can custom-train tools to the needs and criteria of your business and your industry, for even more accurate results.
Manually reading and annotating open-ended text data is a thing of the past.
Machine learning allows you to supplement your quantitative CSAT calculations with quantitative, open-ended survey responses, for deeper data and more fine-grained results.
Discover more with a personalized demo.
Enhance Your CSAT Score
CSAT surveys are a standard measurement across most modern industries for customer satisfaction and customer service efficacy. They offer solid results and quick and easy measurements, but their quantitative data will only get you so far.
Enhance your CSAT score with open-ended questions, for results that could lead to wholly new insights, backed by real opinions. MonkeyLearn’s text analysis tools work constantly and in real time, so you’ll never leave your customers in the cold.
Sign up to MonkeyLearn for free and test out AI tools on your own open-ended survey data.


Rachel Wolff
January 21st, 2021
Posts you might like...


Text Analysis with Machine Learning
Turn tweets, emails, documents, webpages and more into actionable data. Automate business processes and save hours of manual data processing.
Try MonkeyLearn


